
News Release
Personal Consumption Expenditures by State, 2019
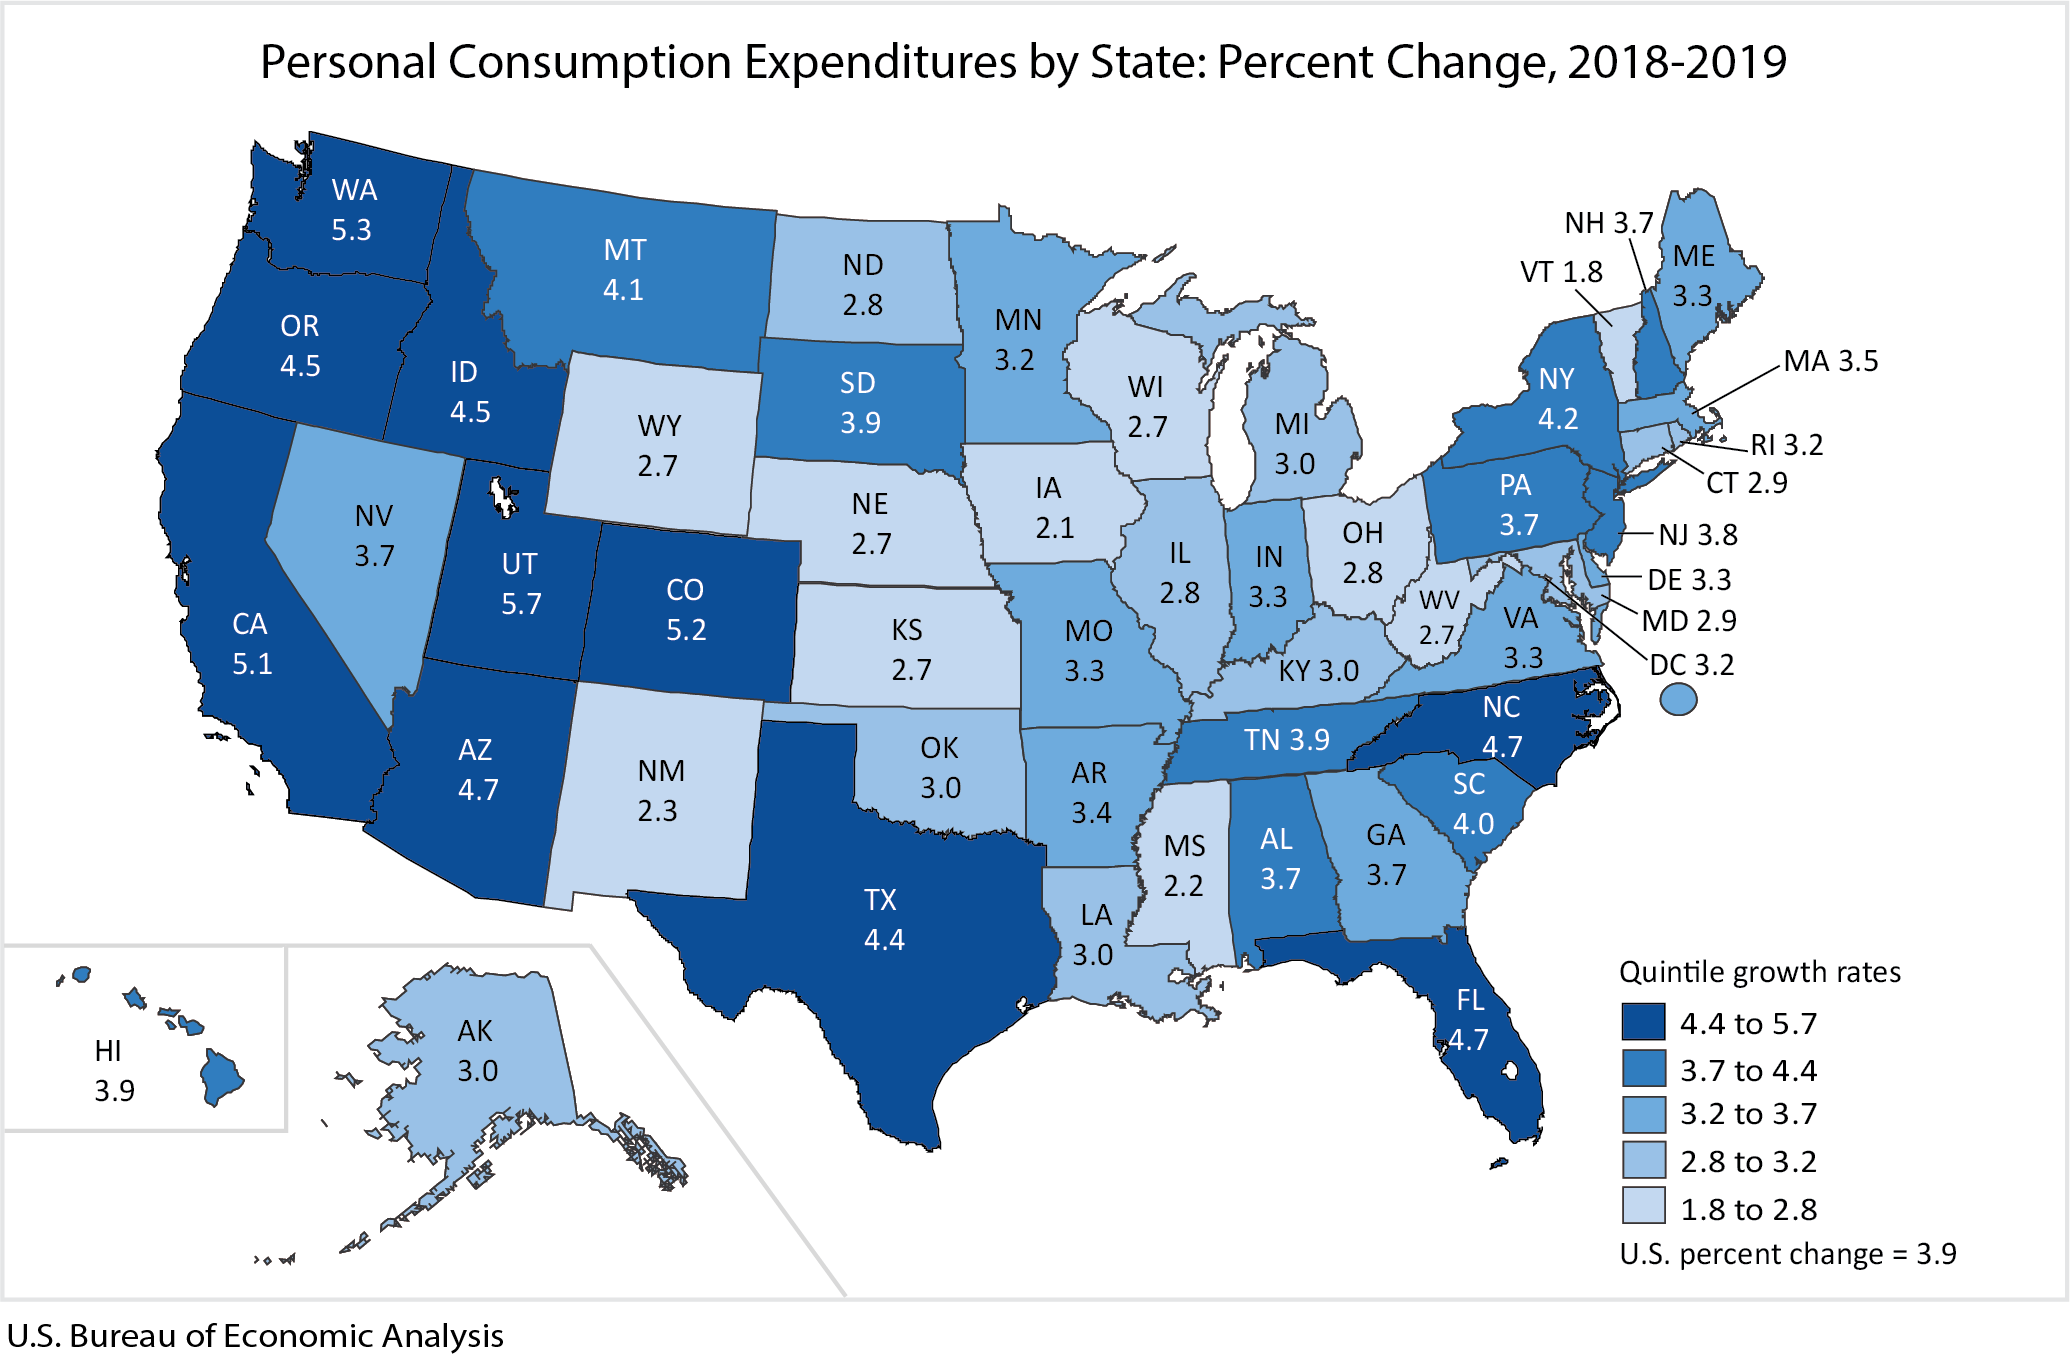
State personal consumption expenditures (PCE) increased 3.9 percent in 2019, a deceleration from the 4.9 percent increase in 2018 (table 1), according to statistics released today by the Bureau of Economic Analysis. The percent change in PCE across all states ranged from 5.7 percent in Utah to 1.8 percent in Vermont.
PCE by state highlights
Expenditures on housing and utilities, and on health care grew 4.3 percent and 4.5 percent, respectively (table 2), and were the leading contributors to growth nationally (table 3).
- Expenditures on housing and utilities, and on health care contributed to PCE growth across all states and the District of Columbia.
- Expenditures on housing and utilities increased 5.1 percent in Utah, the fastest growing state, and was the second leading contributor to growth. Expenditures on financial services and insurance in Utah increased 10.5 percent and was the leading contributor to growth.
- Expenditures on housing and utilities, and on healthcare were the leading contributors to growth in the next three fastest growing states: Washington, Colorado, and California.
Nationally, expenditures on gasoline and other energy goods, and on motor vehicles and parts decreased 4.0 and 0.3 percent, respectively.
- Expenditures on gasoline and other energy goods decreased in every state, while spending on motor vehicles and parts ranged from -2.4 percent in Hawaii to 2.5 percent in Arizona.
- Expenditures on gasoline and other energy goods decreased -7.5 percent in Vermont, the slowest growing state, and was the leading contributor to slow growth.
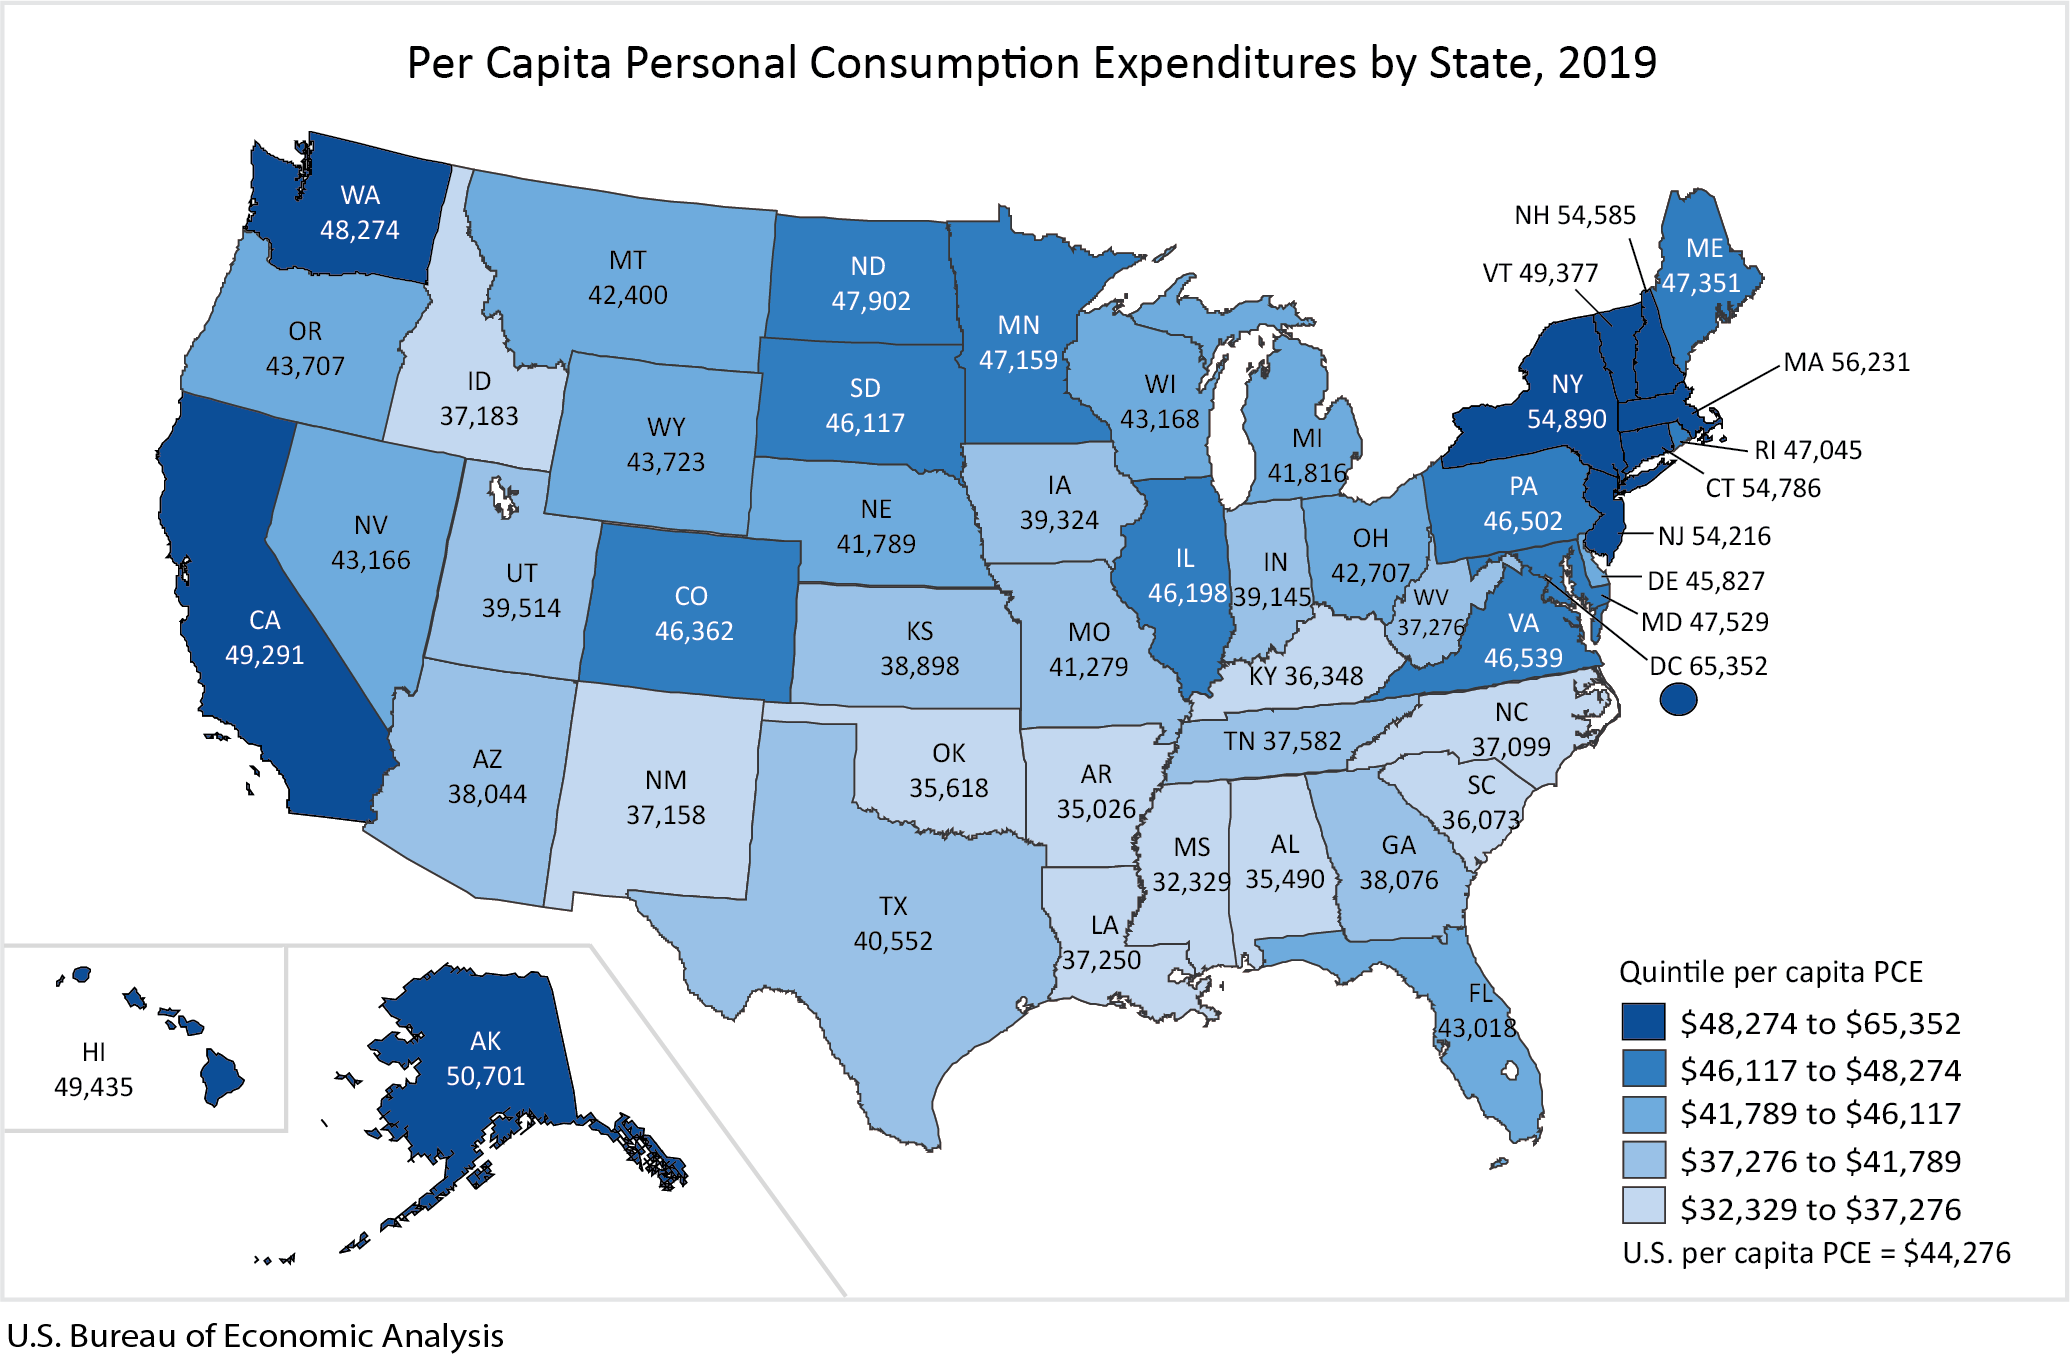
Across all states and the District of Columbia, per capita PCE was $44,276 (table 4). Per capita PCE by state ranged from a high of $56,231 in Massachusetts to a low of $32,329 in Mississippi. Per capita PCE in the District of Columbia was $65,352.
Today, BEA released revised estimates for 2013 to 2018 (table 5) as well. The update incorporated revised source data that are more complete and more detailed than previously available. Additionally, the update includes the results of the July 2020 annual update of the National Income and Product Accounts and the results of the September 2020 annual update of the state personal income statistics.
Next release: October 8, 2021
Personal Consumption Expenditures by State, 2020