
News Release
Gross Domestic Product for Guam, 2020
Gross Domestic Product by Industry and Compensation by Industry, 2019
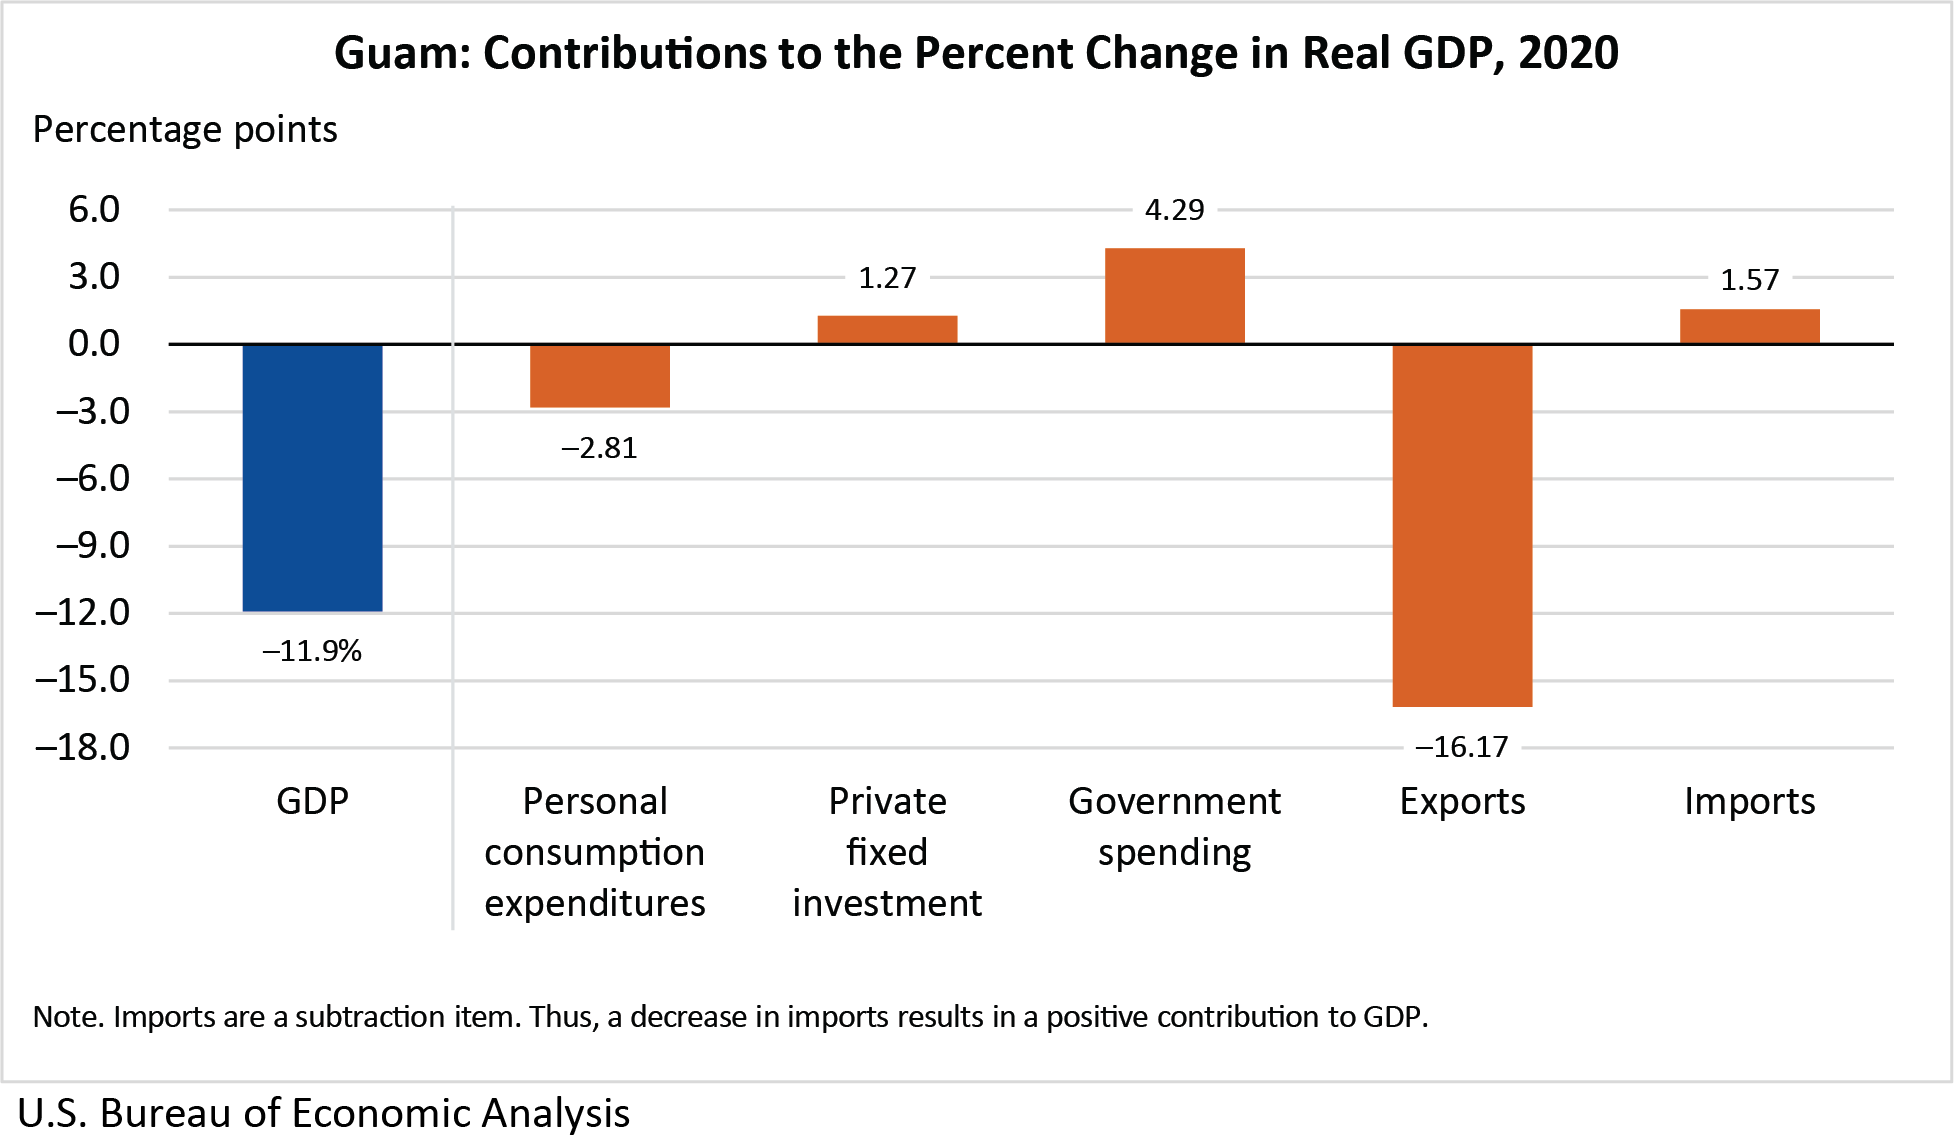
Real gross domestic product (GDP) for Guam decreased 11.9 percent in 2020 after increasing 2.5 percent in 2019 (table 1.3), according to statistics released today by the U.S. Bureau of Economic Analysis (BEA). These statistics were developed under the Statistical Improvement Program funded by the Office of Insular Affairs (OIA) of the U.S. Department of the Interior.
GDP for 2020
The decrease in real GDP reflected decreases in exports of goods and services and personal consumption expenditures (PCE) (table 1.4). These decreases were partly offset by increases in federal government spending, territorial government spending, and private fixed investment. Imports, a subtraction item in the calculation of GDP, declined.
Exports of goods and services decreased 74.1 percent. The decrease in exports was largely accounted for by exports of services, which consists primarily of spending by visitors. Visitor arrivals declined 80 percent according to data from the Guam Visitors Bureau, reflecting the effects of the COVID-19 pandemic.
PCE decreased 4.9 percent, reflecting declines in spending on both goods and services. Nonessential businesses throughout Guam were subject to mandatory reductions in operations due to the COVID-19 pandemic.
Government spending increased 7.9 percent, reflecting growth in federal and territorial government spending.
Federal government spending increased 7.5 percent, reflecting growth in construction spending and compensation of employees. U.S. Department of Defense construction was a notable source of growth, as progress continued on multiple U.S. military projects, including training and aircraft support facilities.
Territorial government spending increased 8.5 percent, reflecting growth in government purchases of goods and services, construction spending, and compensation of employees. The growth in spending was supported by federal grant revenues, including Coronavirus Relief Fund payments.
Private fixed investment increased 6.1 percent, reflecting growth in construction activity. Private-sector construction projects included a luxury hotel in Tumon Bay, a multimillion-dollar cold storage facility, and various residential projects.
GDP by industry and compensation by industry for 2019
In 2019, GDP increased 2.5 percent. The newly available GDP by industry data, which are released on a 1-year lag, reveal that the private sector was the source of the growth in real GDP in 2019 (table 2.5).
Growth in the private sector was widespread; the largest increase was in accommodations, food services, and amusements, which increased 9.1 percent, reflecting growth in visitor spending (table 2.4).
The government sector declined 0.7 percent in 2019, partly offsetting the growth in the private sector. The decline in the government sector primarily reflected a decline in the operating surplus of territorial government enterprises.
Total compensation increased in 2019, reflecting growth in all industries shown (table 2.6). The largest contributor was the construction industry, which includes activities performed by private companies on behalf of the government sector.
The accompanying news release tables present estimates for GDP and its major components, GDP by industry, compensation by industry, and estimates of gross domestic income.
Estimates for 2018 and 2019 that were released on February 16, 2021, have been revised to incorporate updates to source data, including the following:
- Average visitor expenditures by market from the Guam Visitors Bureau,
- Tabulations of gross receipts taxes by industry from the Guam Department of Revenue and Taxation,
- Audited financial statements for the Government of Guam and its independent agencies,
- Tabulations of wage and personnel data provided by the U.S. Department of Defense, and
- Wage and employment information from the U.S. Census Bureau County Business Patterns.
The revised estimates exhibit a pattern of inflation-adjusted GDP growth similar to the previously published estimates (table 1.7).
For more information on the data sources underlying these estimates, see the appendix in "Territorial Economic Accounts for American Samoa, the Commonwealth of the Northern Mariana Islands, Guam, and the U.S. Virgin Islands."
Next release: Fall 2022
Gross Domestic Product for Guam, 2021
Guam GDP by Industry and Compensation by Industry, 2020