
News Release
Personal Consumption Expenditures by State, 2020
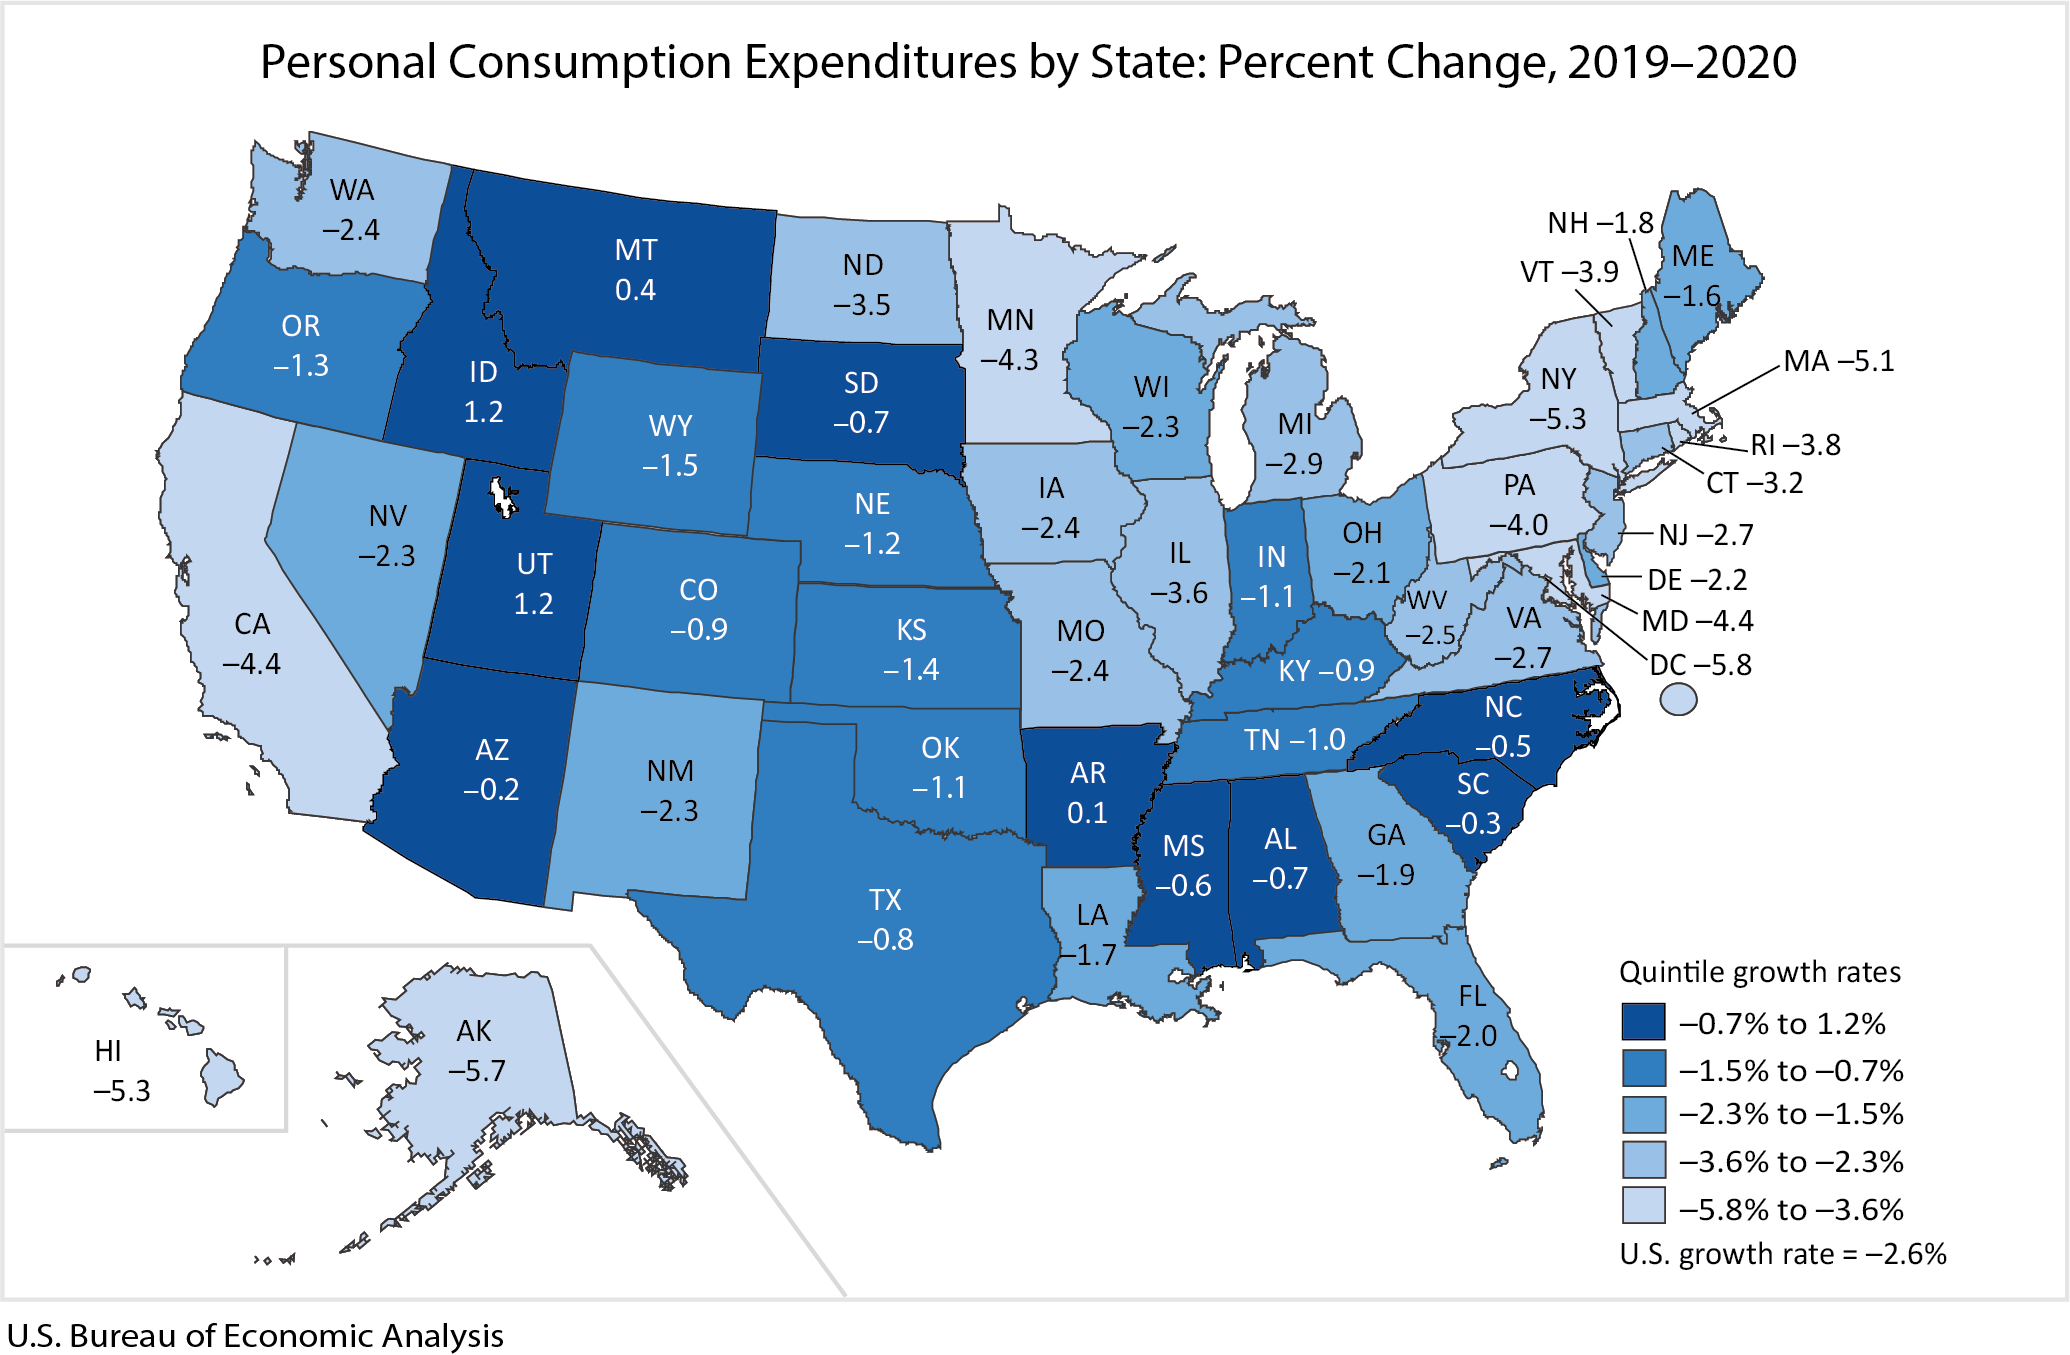
State personal consumption expenditures (PCE) decreased 2.6 percent in 2020 after increasing 3.7 percent in 2019 (table 1), according to statistics released today by the U.S. Bureau of Economic Analysis (BEA). The percent change in PCE across all 50 states and the District of Columbia ranged from 1.2 percent in Idaho and Utah to –5.8 percent in the District of Columbia.
PCE by state highlights
Expenditures on food services and accommodations, recreation services, and health care were the leading contributors to the decrease nationally (table 3).
- Food services and accommodations decreased 20.5 percent nationally (table 2) and was the largest contributor to decreases in the District of Columbia and 27 states including Hawaii and New York; it was the second largest contributor to decreases in 11 states.
- Recreation services decreased 28.6 percent nationally and was the largest contributor to decreases in 4 states including California.
- Health care decreased 6.1 percent nationally and was the largest contributor to decreases in 12 states including Alaska.
Nationally, expenditures on housing and utilities increased 3.8 percent and was the leading contributor to the increases in Idaho, Utah, and Montana. PCE increased in only four states, Idaho, Utah, Montana, and Arkansas.
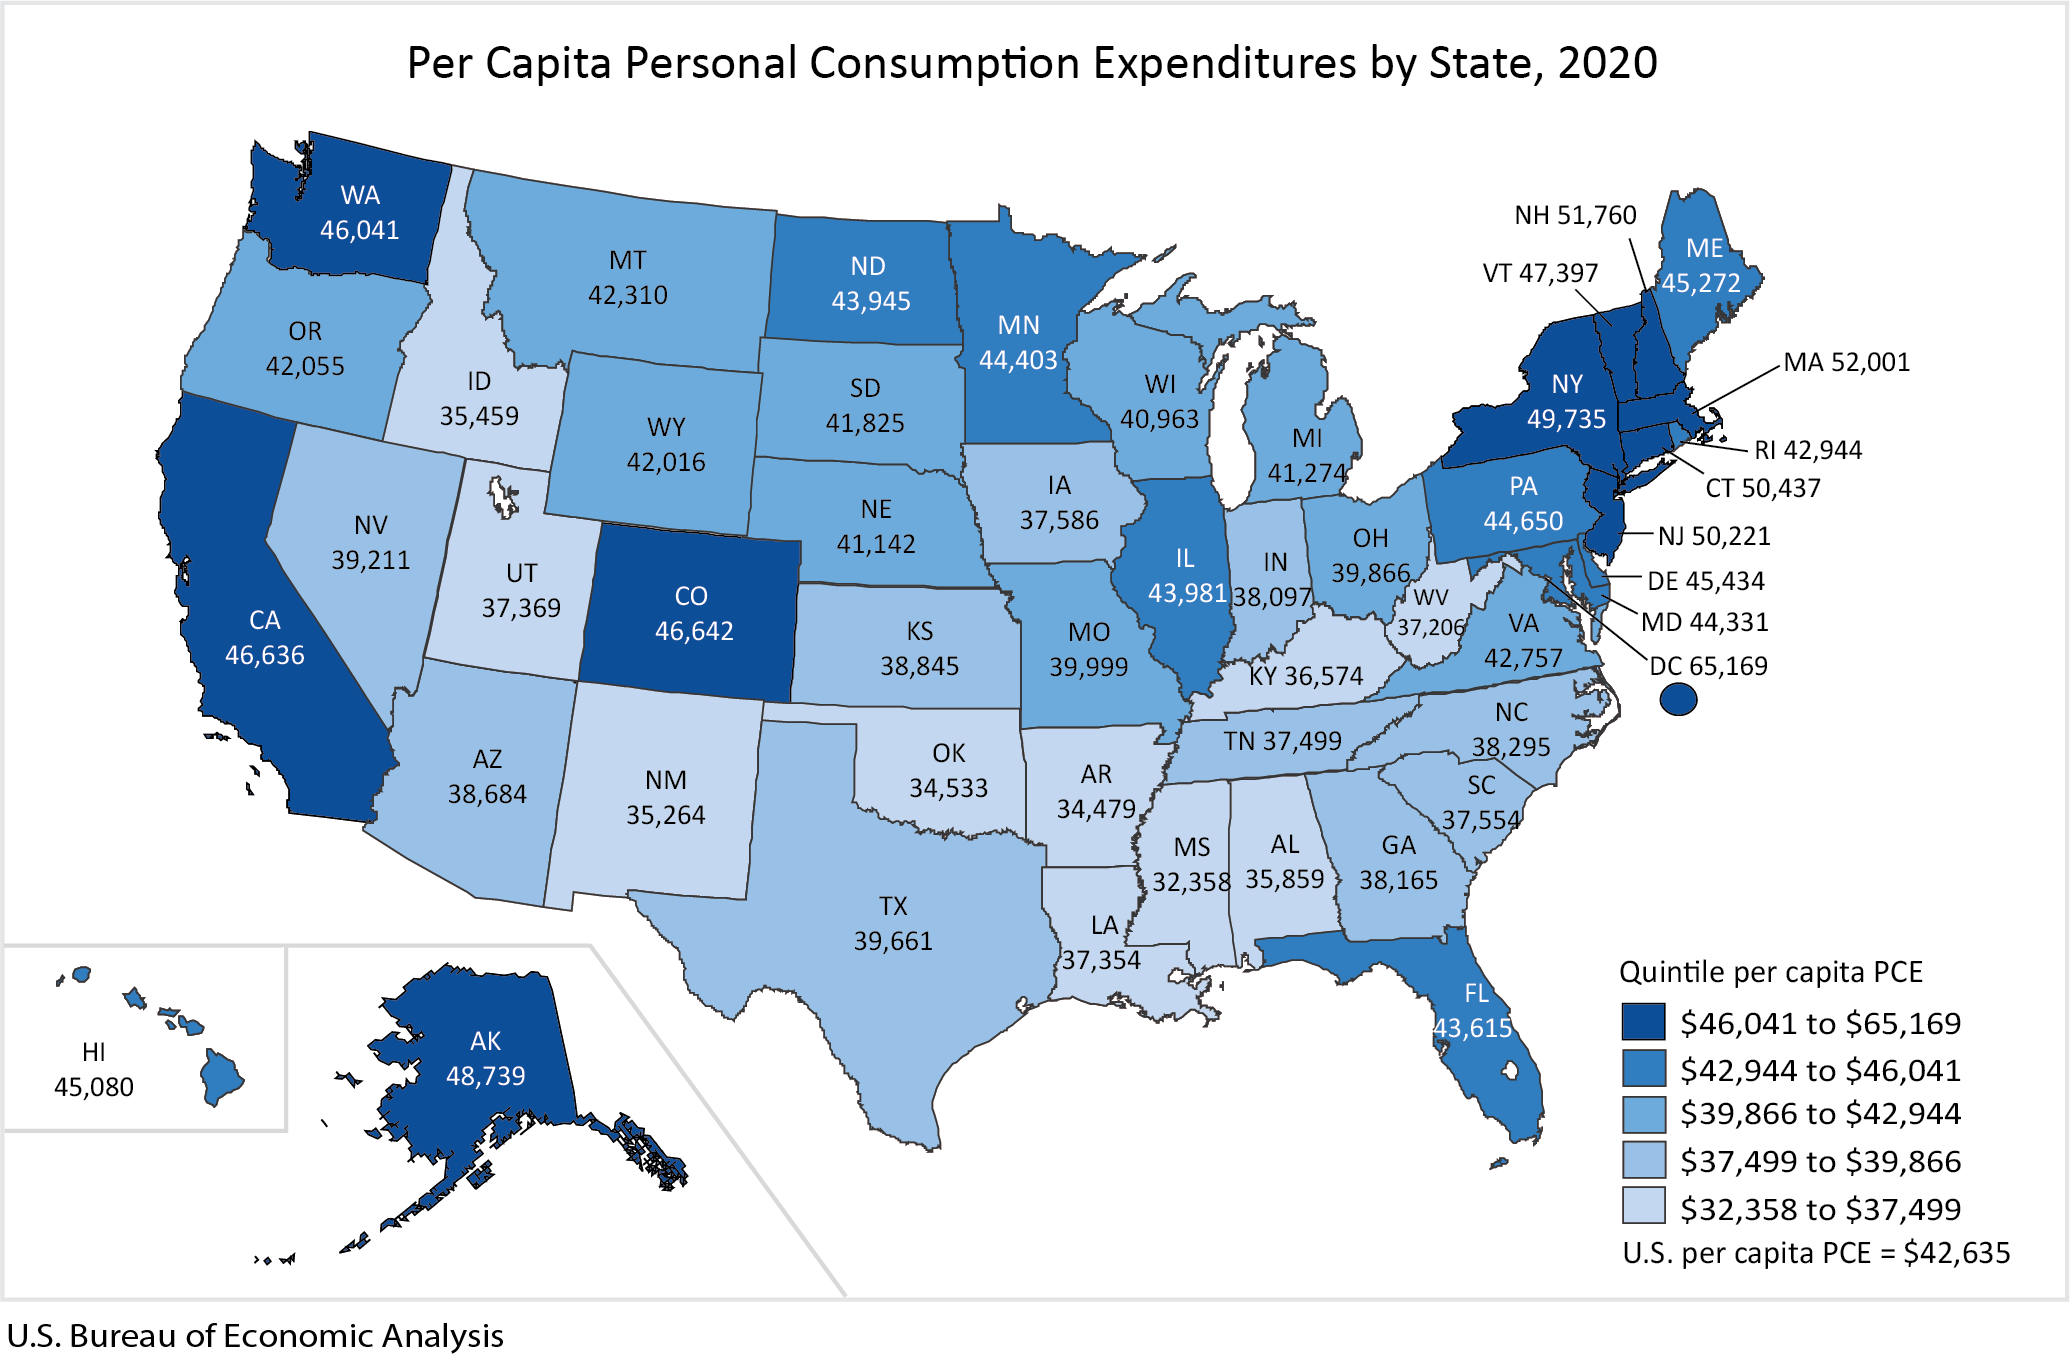
Across all states and the District of Columbia, per capita PCE was $42,635 (table 4). Per capita PCE by state ranged from a high of $52,001 in Massachusetts to a low of $32,358 in Mississippi. Per capita PCE in the District of Columbia was $65,169.
The PCE by state estimates were impacted by the response to the spread of COVID-19, as governments issued and lifted "stay-at-home" orders. This led to rapid changes in demand and consumers canceled, restricted, or redirected their spending. The U.S. government passed several laws to support and sustain businesses and individuals through the pandemic. The extent to which the funds were spent by individuals is implied in the estimates of personal consumption expenditures. The full economic effects of the COVID-19 pandemic cannot be quantified in the PCE by state estimates because the impacts are generally embedded in source data and cannot be separately identified.
Today, BEA released revised statistics for 1997 to 2019 (table 5) as well. The update incorporates revised source data that are more complete and more detailed than previously available. The update includes the results of the July 2021 annual update of the NIPAs and the September 2021 annual update of the state personal income statistics. Also, BEA improved the state PCE methodology, allowing the publication of two additional tables. The additional tables correspond to National Income and Product Accounts (NIPA) tables 2.4.5 and 2.5.5 and are available on BEA's website. The November 2021 issue of the Survey of Current Business will contain an article describing the updates and results.
On December 14, 2021, BEA will release official statistics of real personal consumption expenditures by state for the first time. These data will be combined with statistics on real personal income by state and metropolitan area in a single release for 2020.
BEA state per capita PCE statistics are calculated using Census Bureau midyear population estimates. These annual midyear estimates are based on the 2010 census. BEA will incorporate the Census Bureau midyear population estimates based on the 2020 census results when they become available.
Next release: October 6, 2022
Personal Consumption Expenditures by State, 2021