
News Release
Marine Economy Satellite Account, 2014-2020
New statistics for 2020; prior years updated
The Marine Economy Satellite Account (MESA) statistics released today by the U.S. Bureau of Economic Analysis (BEA) show the marine economy accounted for 1.7 percent (table 3), or $361.4 billion (table 2), of current-dollar U.S. gross domestic product (GDP) in 2020 and 1.7 percent, or $610.3 billion, of current-dollar gross output (table 8).
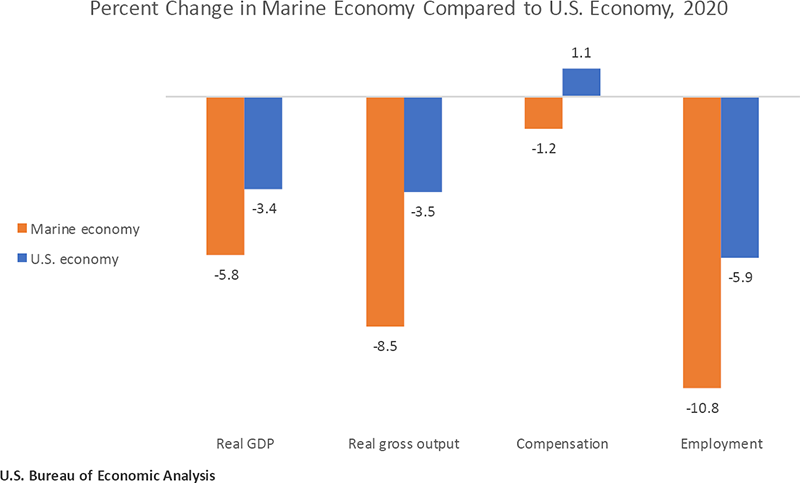
Real (inflation-adjusted) GDP for the marine economy decreased 5.8 percent from 2019 to 2020, compared with a 3.4 percent decrease for the overall U.S. economy. Real gross output for the marine economy decreased 8.5 percent, while marine economy compensation decreased 1.2 percent, and employment decreased 10.8 percent.
Today's release also reflects updated statistics for 2014–2019. Gross output, value added, employment, and compensation were updated to include the results of the 2021 annual update of the National Economic Accounts, which includes the Industry Economic Accounts. The updated statistics reflect newly available and revised source data as well as methodological improvements.
Marine economy estimates, including tourism and recreation estimates, were impacted by the response to the spread of COVID–19 in 2020, as governments issued and lifted "stay-at-home" orders. This led to rapid changes in demand, as consumers canceled, restricted, or redirected their spending. The U.S. government passed several laws to support and sustain businesses and individuals through the pandemic. The full economic effects of the COVID–19 pandemic cannot be quantified in the marine economy estimates because the impacts are generally embedded in source data and cannot be separately identified. For more information, refer to "Federal Recovery Programs and BEA Statistics."
Marine Economy by Activity
Marine economy activities fall into the following 10 general categories:
- Living resources, marine
- Construction, coastal and marine
- Research and education, marine
- Transportation and warehousing, marine
- Professional and technical services, marine
- Minerals, offshore
- Utilities, coastal
- Ship and boat building, nonrecreational
- Tourism and recreation, coastal and offshore
- National defense and public administration
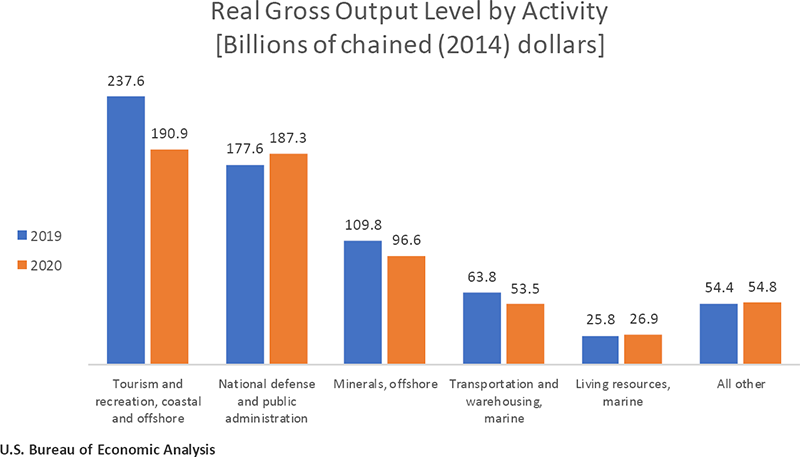
MESA real gross output–principally a measure of the marine economy's inflation-adjusted sales or receipts, which includes sales to final users in the economy (GDP) and sales to other industries (intermediate inputs)–decreased $57.3 billion in 2020 (table 7). Marine economy activity highlights for 2020 include the following:
- Tourism and recreation, coastal and offshore declined 19.7 percent ($46.7 billion) to a level of $190.9 billion, making it the largest contributor to the decline in MESA gross output.
- Minerals, offshore declined 12.0 percent ($13.2 billion) to a level of $96.6 billion, making it the second-largest contributor to the overall decline.
- Transportation and warehousing, marine decreased 16.1 percent ($10.3 billion) to a level of $53.5 billion.
- National defense and public administration, marine was the largest offset to the decline in MESA real gross output, increasing 5.5 percent ($9.7 billion) to a level of $187.3 billion.
Marine Economy by Industry
The marine economy by industry data, including value added (or GDP by industry), gross output, employment, and compensation, show the contribution of different industries to the marine economy.
Marine economy industry highlights for 2020 include the following:
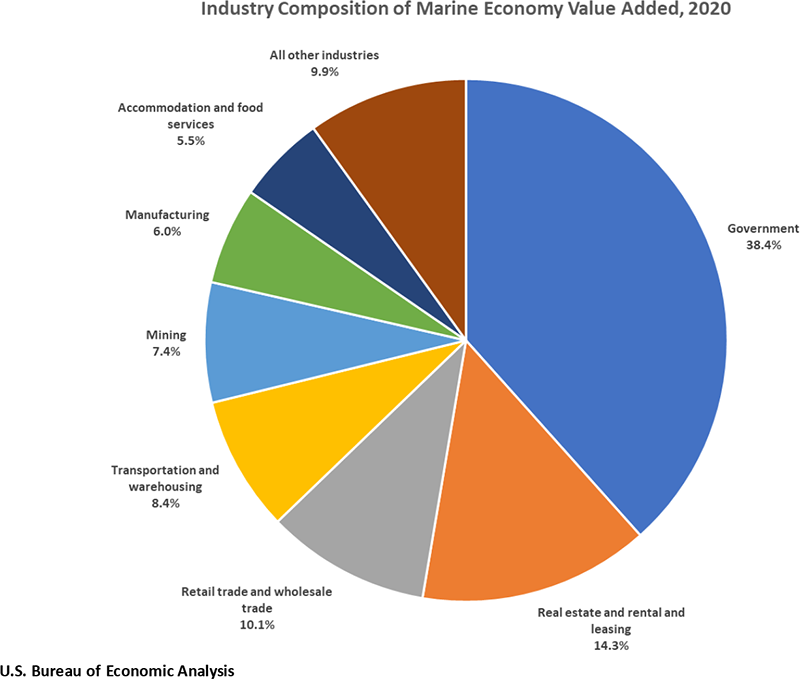
- Government – as a share of marine economy current-dollar value added — was the largest sector, accounting for 38.4 percent ($138.7 billion) (table 6), and was the largest industry sector for compensation ($89.3 billion) and for employment (704,000 full- and part-time equivalent jobs).
- Real estate and rental and leasing had the second-largest share of the marine economy, accounting for 14.3 percent ($51.6 billion) of current-dollar value added.
- Transportation and warehousing accounted for 8.4 percent ($30.2 billion) of marine economy value added, with the second-largest level of compensation ($22.7 billion). Half of the compensation level was from other transportation and support activities, which includes scenic and sightseeing transportation as well as transportation support activities.
- Accommodation and food services accounted for 5.5 percent ($19.8 billion) of value added and showed the second-largest level for employment (353,000) in 2020.
The Marine Economy Satellite Account measures the economic activity associated with the marine economy, identifies the industries responsible for producing these goods and services, and measures the output, value added, compensation, and employment associated with that production. Like other BEA satellite accounts, the MESA was built on BEA's comprehensive supply-use framework. The supply-use tables provide a detailed look at the relationships among industries and how each industry contributes to GDP. In practice, the MESA is a rearrangement of the published supply-use tables with new estimation methods that isolate marine-related spending and production. A variety of private and public data sources were used to identify marine-related spending and production to develop the MESA estimates.
An important feature of the MESA is the presentation of estimates of gross output and value added by marine economic activity, in addition to the traditional presentation of estimates by industry. This allows for the marine economy to be better analyzed in areas where significant economic activity occurs across a variety of traditional industries. For example, the marine tourism and recreation activity spans a variety of traditional industries, which can create difficulties when attempting to analyze the magnitude and growth of marine tourism and recreation. By presenting the statistics by activity, the MESA allows for a more focused examination of marine economic activity in the United States.
The geographic scope of the MESA includes the Atlantic, Pacific, and Arctic Oceans within the Exclusive Economic Zone (approximately 200 nautical miles off the U.S. coast) as well as marginal seas, such as the Gulf of Mexico, Chesapeake Bay, Puget Sound, Long Island Sound, San Francisco Bay, and others. Also included is the U.S. shoreline directly along these bodies of water. Furthermore, the Great Lakes are included up to the international boundary with Canada.
For additional information on the marine economy statistics as well as the data sources and methodology that underlie their preparation, refer to Defining and Measuring the U.S. Ocean Economy.
The Marine Economy Satellite Account was produced in partnership with the National Oceanic and Atmospheric Administration.