News Release
New Foreign Direct Investment in the United States, 2024
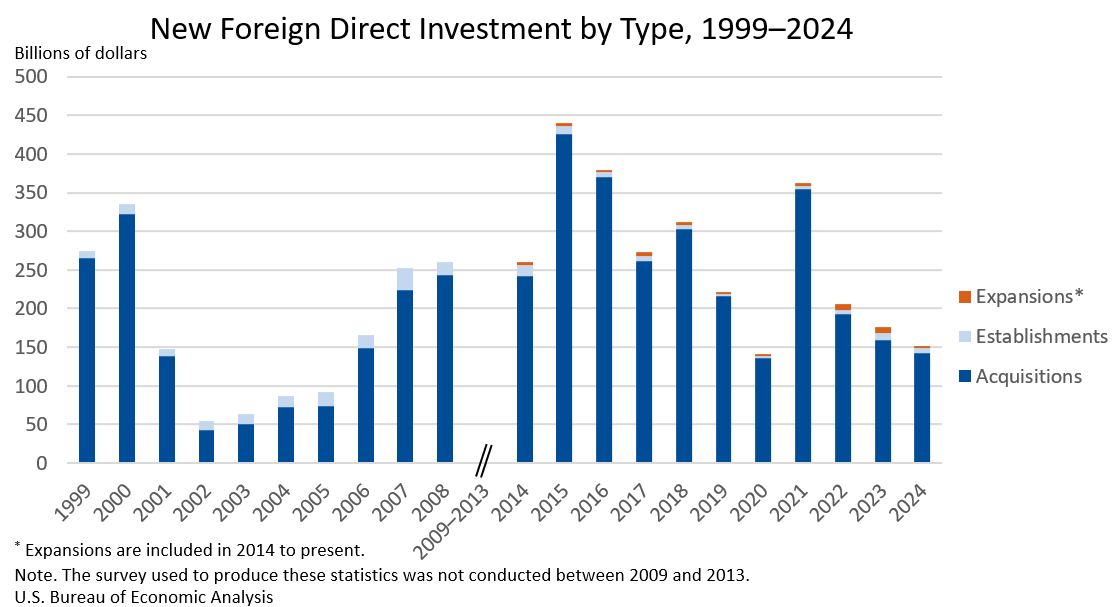
Expenditures by foreign direct investors to acquire, establish, or expand U.S. businesses totaled $151.0 billion in 2024, according to preliminary statistics released today by the U.S. Bureau of Economic Analysis. Expenditures decreased $24.9 billion, or 14.2 percent, from $176.0 billion (revised) in 2023 and were below the annual average of $277.2 billion for 2014–2023. As in previous years, acquisitions of existing U.S. businesses accounted for most of the expenditures.
Expenditures in 2024 for acquisitions were $143.0 billion, expenditures to establish new U.S. businesses were $6.3 billion, and expenditures to expand existing foreign-owned businesses were $1.8 billion. Planned total expenditures, which include both first-year and planned future expenditures, were $157.0 billion.
Employment in 2024 at newly acquired, established, or expanded foreign-owned businesses in the United States was 204,200 employees.
Expenditures by industry, country, and state
By industry, expenditures for new direct investment were largest in the manufacturing sector at $67.7 billion, which accounted for 44.9 percent of total expenditures. Within manufacturing, expenditures were largest in chemical manufacturing ($23.7 billion). There were also notable expenditures in the finance and insurance sector ($23.2 billion) and utilities ($16.0 billion).
The country with the largest investment was Ireland ($30.1 billion), followed by Canada ($23.9 billion).1 By region, Europe contributed the most new investment, $96.7 billion, or 64.0 percent of all new investment in 2024. Asia and Pacific was the second-largest investing region, with $23.2 billion in expenditures.
By state, Texas received the most investment in 2024, with $22.8 billion in investment expenditures. Other states with significant investment expenditures included Georgia ($16.3 billion) and California ($12.9 billion).
Greenfield expenditures
Greenfield investment expenditures—expenditures to establish a new U.S. business or to expand an existing foreign-owned U.S. business—were $8.1 billion in 2024. By industry, greenfield expenditures were largest in the professional, scientific, and technical services sector, totaling $2.8 billion, led by management, scientific, and technical consulting ($1.6 billion). By region, Europe ($3.8 billion), Latin America and Other Western Hemisphere ($1.4 billion), and Asia and Pacific ($1.2 billion) had the largest greenfield expenditures. Wyoming ($2.0 billion) and New Mexico ($1.4 billion) received the highest levels of greenfield investment by state.
Planned total expenditures for greenfield investment initiated in 2024, which include both first-year and planned future expenditures, were $14.1 billion.
Employment by industry, country, and state
In 2024, current employment of acquired enterprises was 203,600. Total planned employment, which includes the current employment of acquired enterprises, the planned employment of newly established business enterprises when fully operational, and the planned employment associated with expansions, was 213,200.
By industry, the manufacturing sector accounted for the largest number of current employees (73,600). Ireland (43,100) and Canada (37,500) accounted for the largest number of current employees by country. Florida (32,700) was the state with the largest current employment resulting from new investment, followed by Texas (18,200) and New York (14,200).
| Previously Published | Revised | |
|---|---|---|
| First-year expenditures | 148.8 | 176.0 |
| U.S. businesses acquired | 136.5 | 158.7 |
| U.S. businesses established | 7.4 | 9.0 |
| U.S. businesses expanded | 5.0 | 8.3 |
| Planned total expenditures | 175.9 | 218.8 |
| U.S. businesses acquired | 136.5 | 158.7 |
| U.S. businesses established | 23.5 | 26.3 |
| U.S. businesses expanded | 16.0 | 33.8 |
| U.S. Bureau of Economic Analysis | ||
Related Data Tables
Starting with this release, BEA is not including tables in the body of the news release. For the 2024 new foreign direct investment statistics highlighted in this release, as well as estimates for earlier years, see the below data tables in BEA’s Interactive Data Application and Supplemental Data Tables.
First-year and planned total expenditures
First-Year and Planned Total Expenditures, Industry of Affiliate by Type of Investment
First-Year and Planned Total Expenditures, Country of UBO by Type of Investment
First-Year and Planned Total Expenditures, State by Type of Investment
First-Year and Planned Total Expenditures, Industry of UBO by Type of Investment
First-Year and Planned Total Expenditures, by Industry of Affiliate (All Industries)
First-Year and Planned Total Expenditures, by Country of UBO (All Countries)
First-Year Expenditures, Country of UBO by Industry of Affiliate
First-Year Expenditures, Country of Foreign Parent and UBO
Planned Total Expenditures for Establishments and Expansions, by Type of Expenditure
Greenfield investments (expenditures for U.S. businesses established and expanded)
Planned Expenditures for Greenfield Investments, Type of Investment by Year
Planned Expenditures for Greenfield Investments, Industry of Affiliate by Year
Planned Expenditures for Greenfield Investments, Country of UBO by Year
Planned Expenditures for Greenfield Investments, State by Year
Expenditures for Greenfield Investments, Year of Investment Expenditure by Year Investment Was Initiated
Number of investments by size (supplemental data tables)
Number of Investments Initiated, Distribution of Planned Total Expenditures, Size by Type of Investment
Employment
Current and Planned Employment, Industry of Affiliate by Type of Investment
Current and Planned Employment, Country of UBO by Type of Investment
Current and Planned Employment, State by Type of Investment
Discontinued tables
Some data tables previously produced alongside this news release have been discontinued as of July 11, 2025. Data tables on sales, net income, and balance sheets of new affiliates were discontinued and have been archived. These tables have never been part of the data tables included in the body of the news releases.
Note. With the release of 2025 new foreign direct investment statistics in July 2026, the 2024 data will be superseded and can then be accessed in BEA’s Data Archive.
For resources, definitions, and more, visit “Additional Information.”
Next release: July 2026
New Foreign Direct Investment in the United States, 2025
1 As measured by country of ultimate beneficial owner (UBO; see “Additional Information” for a description).
