
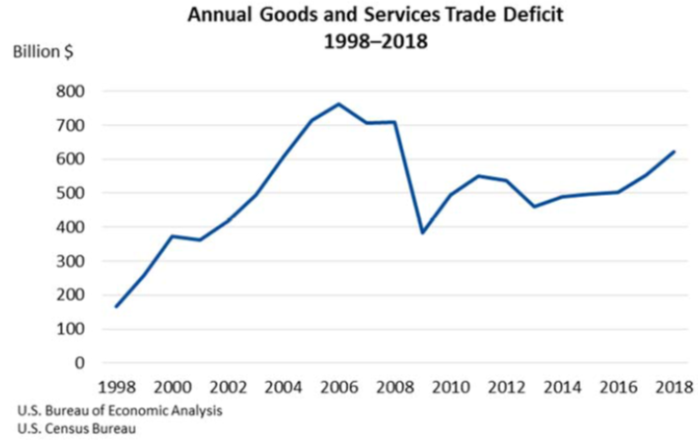
The U.S. international trade deficit increased in 2018 according to the U.S. Bureau of Economic Analysis and the U.S. Census Bureau. The deficit increased from $552.3 billion in 2017 to $622.1 billion in 2018, as imports increased more than exports. As a percentage of U.S. gross domestic product, the goods and services deficit was 3.0 percent in 2018, up from 2.8 percent in 2017. The goods deficit increased from $807.5 billion in 2017 to $891.3 billion in 2018, and the services surplus increased from $255.2 billion in 2017 to $269.2 billion in 2018.
Exports
Exports of goods and services increased $149.7 billion, or 6.4 percent, in 2018 to $2,500.8 billion. Exports of goods increased $118.9 billion and exports of services increased $30.7 billion.
- The largest increases in exports of goods were in industrial supplies and materials ($74.1 billion) and in capital goods ($28.7 billion).
- The largest increases in exports of services were in other business services ($10.5 billion), which includes research and development services; professional and management services; and technical, trade‐related, and other services, in travel (for all purposes including education) ($3.7 billion), and in transport ($3.7 billion).
Imports
Imports of goods and services increased $219.5 billion, or 7.6 percent, in 2018 to $3,122.9 billion. Imports of goods increased $202.8 billion and imports of services increased $16.7 billion.
- The largest increases in imports of goods were in industrial supplies and materials ($68.3 billion), in capital goods ($52.7 billion), and in consumer goods ($46.1 billion).
- The largest increases in imports of services were in travel (for all purposes including education) ($9.1 billion), in other business services ($7.5 billion), and in transport ($6.6 billion). A decrease in insurance services ($12.4 billion) partly offset the increases.
For more information, read the full report.