
Today, the Bureau of Economic Analysis released prototype statistics for personal consumption expenditures, private fixed investment, and net exports of goods for Puerto Rico. These annual statistics cover the time period from 2012 to 2017.
The estimates released today are a major step toward the goal of producing gross domestic product (GDP) statistics for Puerto Rico that are consistent with international guidelines and that are directly comparable to data for other U.S. territories, states, the nation, and many other countries.
Personal consumption expenditures
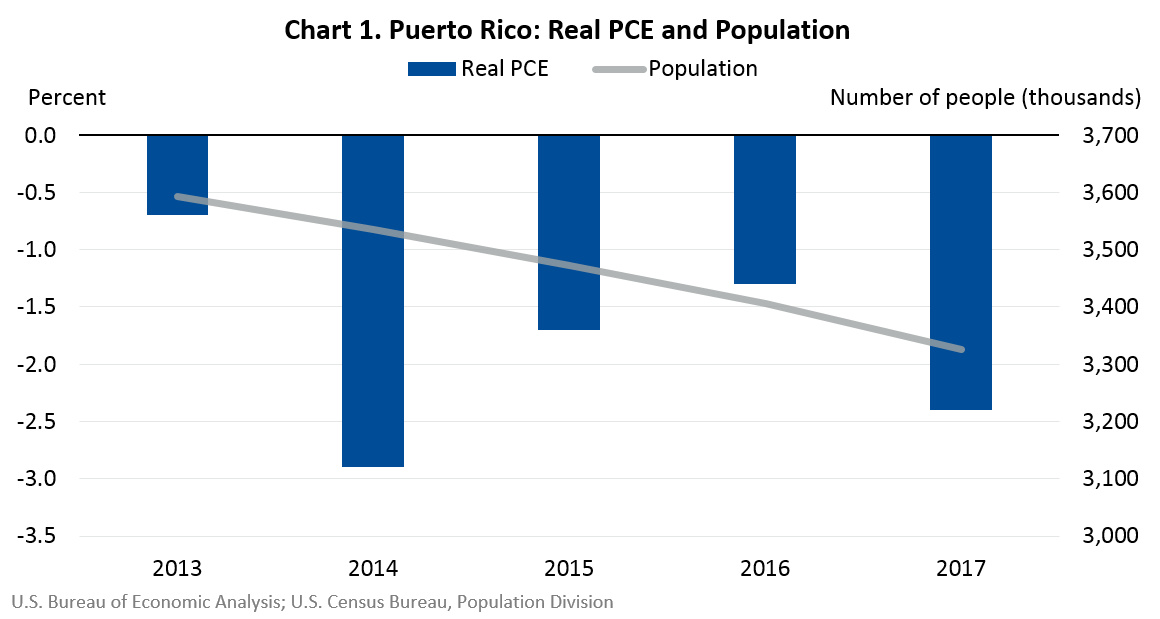
Personal consumption expenditures (PCE), also referred to as consumer spending, measures the goods and services purchased by households who are resident in Puerto Rico. From 2012 to 2017, “real,” or inflation-adjusted, consumer spending for Puerto Rico contracted at an average annual rate of 1.8 percent, consistent with steady declines in the population over this time period. Chart 1 shows the year-by-year decline in real consumer spending and population for Puerto Rico.

Private fixed investment
Private fixed investment (PFI) measures spending by private businesses, nonprofit institutions, and households on fixed assets in the Puerto Rico economy. Spending is grouped into three categories: structures, equipment, and intellectual property products.
After decreasing in 2013, real PFI for Puerto Rico increased for four consecutive years. From 2013 to 2017, real spending grew 3.2 percent. The growth reflected increases in equipment spending and in spending on intellectual property products, including research and development. These increases were partly offset by a decrease in spending on structures. The decline in structures reflected a large decrease in spending on residential structures that was partly offset by an increase in spending on nonresidential structures.
Net exports of goods
The trade balance in goods—the difference between exports and imports—was positive for all years from 2012 to 2017. The surplus ranged from $12.4 billion in 2012 to $28.6 billion in 2015.
The majority of exported goods, approximately 74 percent over this period, were pharmaceuticals and organic chemicals. Other significant exports were medical devices and equipment—which are embedded within consumer goods and within capital goods—and food and beverages.
Within imports of goods, pharmaceuticals and organic chemicals accounted for a large share; roughly 43 percent of the total. Petroleum products accounted for around 12 percent of imports, and food and beverages accounted for approximately 10 percent. Most petroleum and food for domestic consumption is imported.
The public is invited to submit comments by emailing territories@bea.gov. Feedback will be used to help improve the data sources and methodology used in preparing these statistics. For more information, read the full report.