
News Release
Prototype Economic Statistics for Puerto Rico, 2012-2017
SAN JUAN, PUERTO RICO (October 15, 2019) -- Today, the Bureau of Economic Analysis (BEA) released prototype statistics for personal consumption expenditures, private fixed investment, and net exports of goods for Puerto Rico. These annual statistics cover the time period from 2012 to 2017. In conjunction with this release, BEA is requesting feedback to refine the data sources and methods used to prepare these statistics.
The estimates released today are a major step toward the goal of producing gross domestic product (GDP) statistics for Puerto Rico that are consistent with international guidelines and that are directly comparable to data for other U.S. territories, states, the nation, and many other countries.1
These statistics—which apply the most up-to-date source data and methodology available to BEA—can be used to understand Puerto Rico's economic trends and support economic development strategies, particularly as the island continues its recovery from Hurricanes Irma and Maria.
Highlights from this initial set of Puerto Rico statistics are below.
Personal consumption expenditures
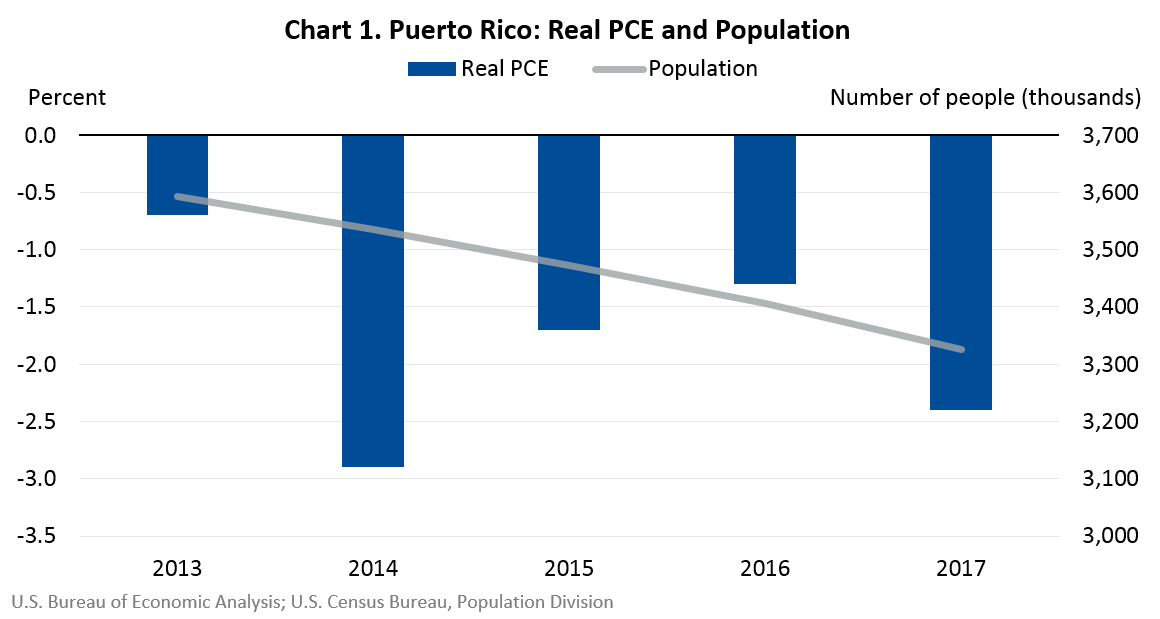
Personal consumption expenditures (PCE), also referred to as consumer spending, measures the goods and services purchased by households who are resident in Puerto Rico.2 From 2012 to 2017, "real," or inflation-adjusted, consumer spending for Puerto Rico contracted at an average annual rate of 1.8 percent, consistent with steady declines in the population over this time period. Chart 1 shows the year-by-year decline in real consumer spending and population for Puerto Rico.
The largest decreases in real consumer spending occurred in 2014 and 2017 (see Table 1.3). In 2014, as wages dropped and consumer prices continued to increase, residents reduced their spending on both goods and services. The declines within goods were widespread; the largest decreases were for motor vehicles and "other" nondurable goods, which includes items such as medicine and clothing. In 2017, Hurricanes Irma and Maria caused catastrophic damage that restricted residents' access to many goods and services. The decreases in health care, housing and utilities, and "other" services (including education services) were especially large.
Private fixed investment
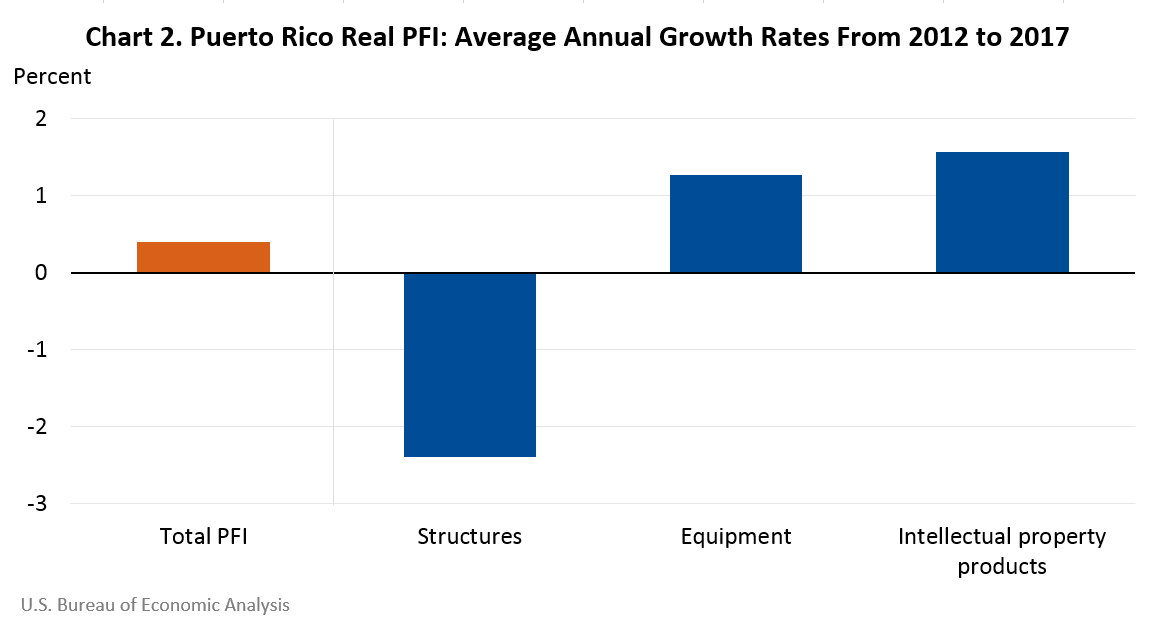
Private fixed investment (PFI) measures spending by private businesses, nonprofit institutions, and households on fixed assets in the Puerto Rico economy. Spending is grouped into three categories: structures, equipment, and intellectual property products. Chart 2 shows the average annual growth rates for real PFI and its major components from 2012 to 2017.
After decreasing in 2013, real PFI for Puerto Rico increased for four consecutive years (see Table 2.3). From 2013 to 2017, real spending grew 3.2 percent. The growth reflected increases in equipment spending and in spending on intellectual property products, including research and development. These increases were partly offset by a decrease in spending on structures. The decline in structures reflected a large decrease in spending on residential structures that was partly offset by an increase in spending on nonresidential structures.
In 2017, spending on nonresidential structures increased, reflecting the rebuilding of commercial properties in the months following Hurricanes Irma and Maria. In contrast, spending on residential structures decreased, reflecting the continued drop in demand for homes consistent with the downward trend in the population, coupled with an even further decline after the hurricanes.
Net exports of goods
The trade balance in goods—the difference between exports and imports—was positive for all years from 2012 to 2017. The surplus ranged from $12.4 billion in 2012 to $28.6 billion in 2015 (see Table 3.1). Chart 3 shows the trade surplus, in addition to total exports and total imports of goods.
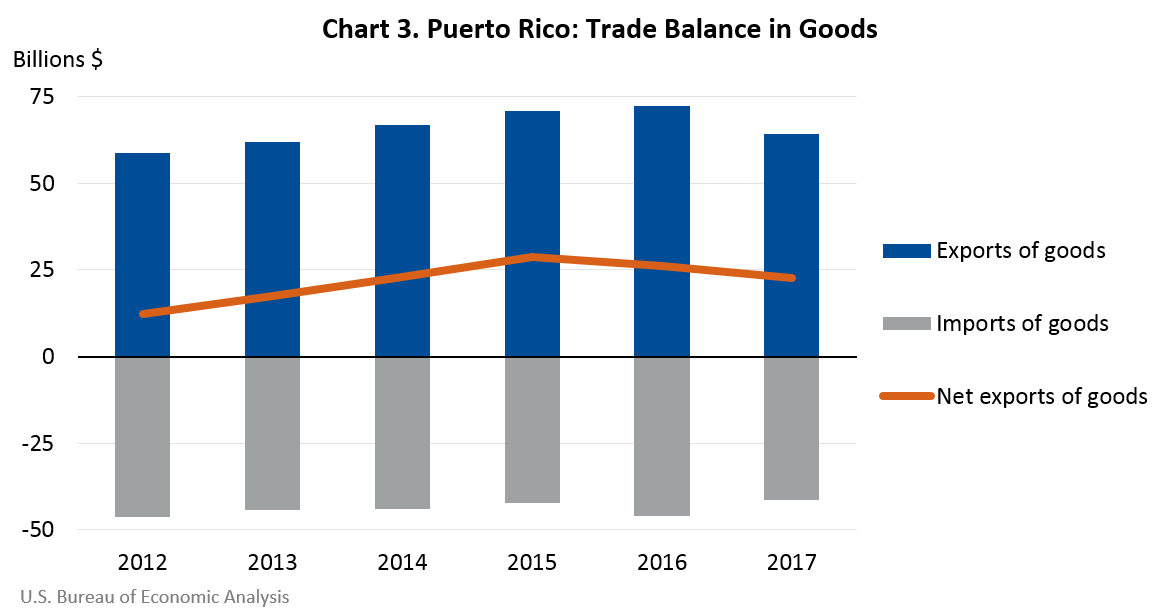
The majority of exported goods, approximately 74 percent over this period, were pharmaceuticals and organic chemicals.3 Other significant exports were medical devices and equipment—which are embedded within consumer goods and within capital goods—and food and beverages.
Real exports of goods grew from 2012 to 2015; the highest growth was in 2014 (see Table 3.3). The increase in 2014 reflected growth of over 50 percent in consumer goods excluding food, autos, and pharmaceuticals. The growth in this series was due to a large increase in exports of implanted or worn medical appliances. Real exports turned down in 2016 and then decreased 14.4 percent in 2017, reflecting the effects of the September hurricanes on the manufacturing sector.
Within imports of goods, pharmaceuticals and organic chemicals accounted for a large share; roughly 43 percent of the total. Petroleum products accounted for around 12 percent of imports, and food and beverages accounted for approximately 10 percent. Most petroleum and food for domestic consumption is imported.
Over the period from 2012 to 2017, the largest increase in real imports of goods was in 2016, and the largest decrease was in 2017. Real imports of goods grew 11.2 percent in 2016, reflecting a sharp increase in pharmaceuticals and organic chemicals. In 2017, real imports of goods decreased 12.4 percent. The decrease was more than accounted for by a decline in pharmaceuticals and organic chemicals, which reflected both the effects of the hurricanes and a return to earlier levels of imports within this category.
Future directions
The public is invited to submit comments by emailing territories@bea.gov. Feedback will be used to help improve the data sources and methodology used in preparing these statistics.
Note that continued efforts remain contingent on resource availability. Future expansions to the economic statistics for Puerto Rico include the development of prototype estimates of the remaining components of GDP and total GDP. The remaining components of GDP are inventory investment, net exports of services, and government spending.
Because Puerto Rico is not included in most of the major surveys used by BEA to estimate U.S. GDP, the support and assistance provided by the government of Puerto Rico will be critical to the successful production of these estimates.
1 BEA currently produces similar economic data, and GDP, for American Samoa, the Commonwealth of the Northern Mariana Islands (CNMI), Guam, and the U.S. Virgin Islands, under an agreement with the Office of Insular Affairs of the U.S. Department of the Interior. Historical time series of these estimates can be accessed at BEA's GDP for the U.S. Territories.
2 PCE also includes expenses of nonprofit institutions serving households.
3 Also includes medicinal and dental products.