
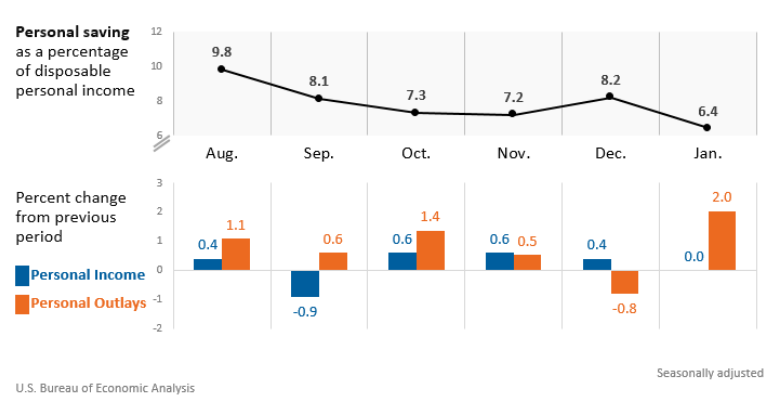
Personal income increased $9.0 billion, or less than 0.1 percent at a monthly rate, while consumer spending increased $337.2 billion, or 2.1 percent, in January. The increase in personal income primarily reflected an increase in compensation of employees that was partly offset by a decrease in government social benefits. The personal saving rate (that is, personal saving as a percentage of disposable personal income) was 6.4 percent in January, compared with 8.2 percent in December.
Personal income
In January, personal income increased, primarily reflecting an increase in compensation of employees that was partly offset by a decrease in government social benefits.
- Within compensation of employees, the increase primarily reflected an increase in private wages and salaries, based on data from the Bureau of Labor Statistics (BLS) Current Employment Statistics(CES). Wages and salaries of services-producing industries increased $38.4 billion, while wages and salaries of goods-producing industries increased $5.2 billion.
- Within government social benefits, a decrease in “other” benefits was partly offset by an increase in Social Security. Within “other” benefits, the decrease primarily reflected the expiration of the expanded Child Tax Credit, authorized by the American Rescue Plan Act of 2021. For more information, refer to “How does the Child Tax Credit provision of the American Rescue Plan Act of 2021 impact the NIPAs?”. Within Social Security, the increase primarily reflected a 5.9 percent cost of living adjustment. Additional information on factors affecting monthly personal income can be found on Effects of Selected Federal Pandemic Response Programs on Personal Income.
Consumer spending
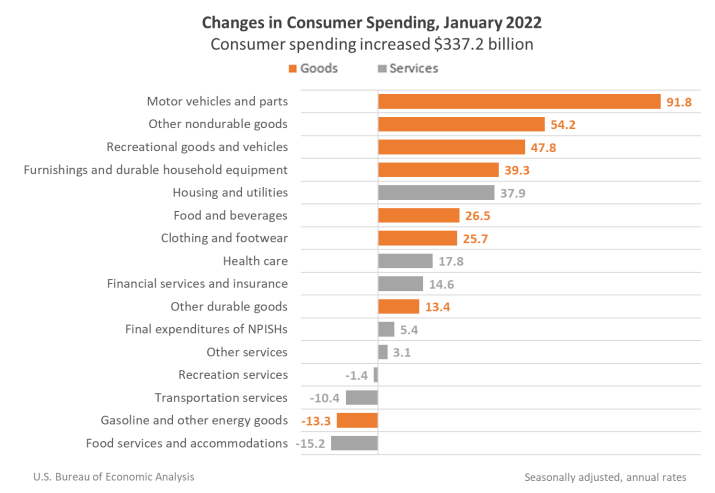
Personal outlays increased in January, primarily reflecting increases in consumer spending for both goods and services.
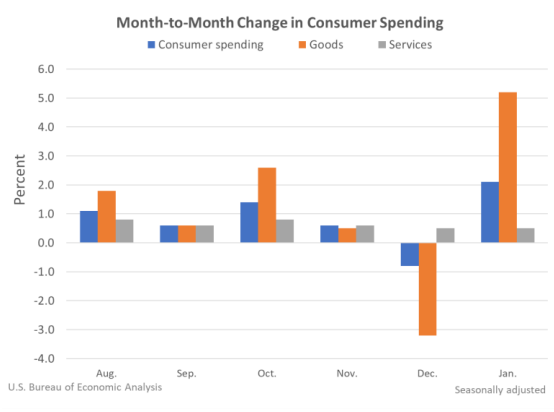
- Within goods, both durable and nondurable goods increased.
- The increase in durable goods primarily reflected increases in motor vehicles and parts (led by new motor vehicles, specifically, light trucks), based on unit sales data from Wards Intelligence; recreational goods and vehicles (led by information processing equipment), based on data from the Census Monthly Retail Trade Survey (MRTS); and furnishings and durable household equipment (led by furniture) based on MRTS data.
- The increase in nondurable goods primarily reflected an increase in “other” nondurable goods, which includes newspapers and periodicals, household supplies, and games and toys, based on MRTS data.
- The increase in durable goods primarily reflected increases in motor vehicles and parts (led by new motor vehicles, specifically, light trucks), based on unit sales data from Wards Intelligence; recreational goods and vehicles (led by information processing equipment), based on data from the Census Monthly Retail Trade Survey (MRTS); and furnishings and durable household equipment (led by furniture) based on MRTS data.
- Within services, the increase primarily reflected an increase in housing and utilities (led by household utilities) based on data from the Energy Information Administration.
PCE price index
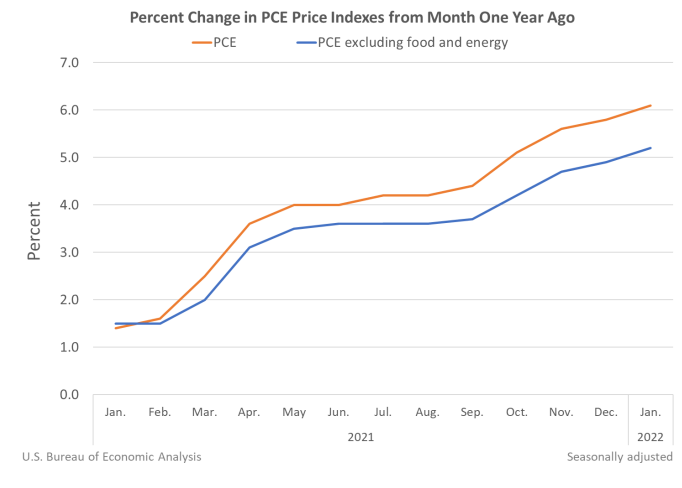
The personal consumption expenditures price index for January increased 6.1 percent from one year ago, reflecting increases in both goods and services. Energy prices increased 25.9 percent while food prices increased 6.7 percent. Excluding food and energy, the PCE price index for January increased 5.2 percent from one year ago.
For more information, read the full release.