
BEA today updated and expanded prototype statistics that look more deeply into U.S. exports, revealing the mix of foreign and domestic content used to make exported goods and services.
For example, a tire manufactured in Ohio and sold in Canada might be made with rubber from China and steel belting from Mexico. Traditional trade statistics can’t separate the foreign inputs, like the tire’s rubber and steel, from the overall value of U.S. exports. However, these statistics can, helping untangle complex supply chains and deepening the public’s understanding of them.
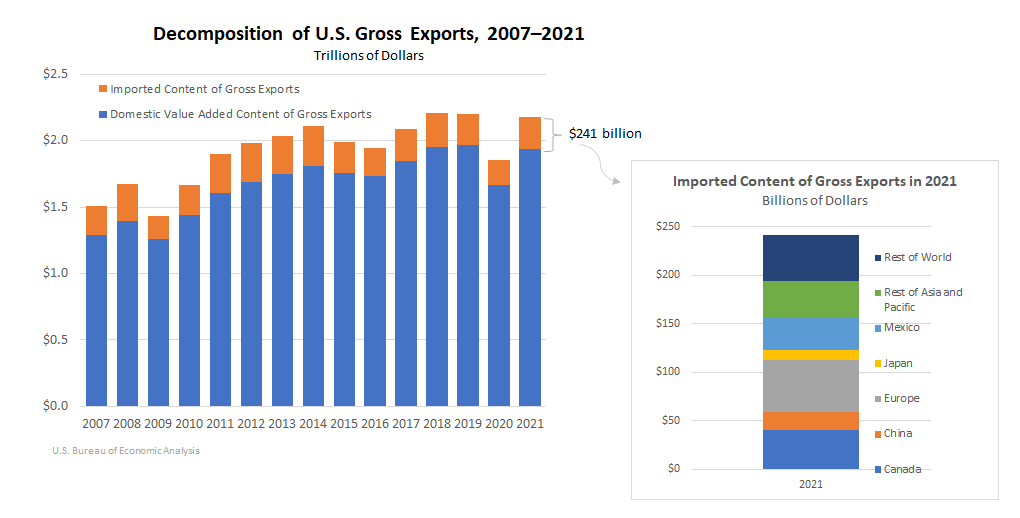
Known as trade in value added, or TiVA, the prototype statistics show that 11.1 percent, or $241.2 billion, of the value of U.S. exports in 2021 came from inputs from other countries. That’s up from 9.9 percent, or $183.5 billion, from foreign inputs in 2020.
The statistics also provide insights into the U.S. industries behind the 88.9 percent, or $1.94 trillion, of export value that came directly from U.S. production in 2021. (That compares to 90.1 percent, or $1.67 trillion, in 2020.)
In traditional trade statistics, the full global presence of some U.S. industries is obscured, because they provide content embedded in other industries’ exports. TiVA data show how these domestic industries contribute to exports.
The statistics also show which parts of the world receive the value added created by different U.S. industries. And they show which parts of the world supply content used in the production of U.S. exports.
TiVA statistics are part of BEA’s effort to increase understanding of U.S. trade and global value chains—the increasingly complicated supply chains that can link multiple countries together in the stages to produce a final good or service.
BEA issued its first set of prototype TiVA statistics in 2021. Today’s release updates and expands those statistics by:
- Adding 2021 data and revising the 2007-2020 data.
- Increasing the number of industry groups from 81 to 138.
- Adding two new regional breakouts—trade with Japan and trade with Rest of Asia and Pacific (excluding China and Japan). They join the five regional breakouts in the first data set: China, Canada, Mexico, Europe, and Rest of World.
The TiVA statistics are produced as part of a collaboration with the National Center for Science and Engineering Statistics of the National Science Foundation.
For more about how to use TiVA data, see BEA’s Global Value Chains webpage and the February Survey of Current Business article, “National Trade in Value Added Statistics: Uses and Applications,” which includes examples drawn from the first set of statistics released in 2021.