
News Release
Gross State Product: New estimates for 1999 and revised estimates for 1993-98
| Richard Beemiller: | (202) | 6069210 | BEA 0116 |
| Cliff Woodruff: | 6069234 |
NEW ESTIMATES for 1999 and
REVISED ESTIMATES for 199398
The U.S. Bureau of Economic Analysis (BEA) is releasing estimates of gross state product (GSP) for 1999 and revised estimates for 199398 today.* GSP is the market value of the goods and services produced by the labor and property located in a state. It is the state counterpart of the nation's gross domestic product (GDP).
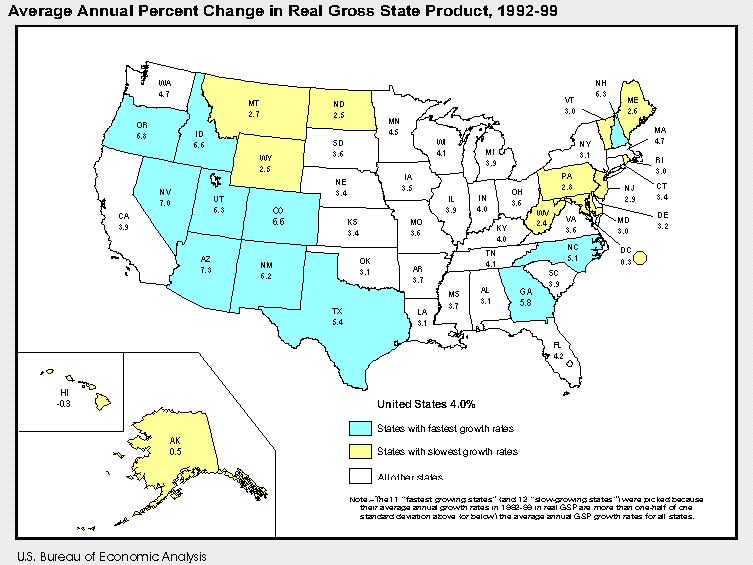
From 1992, the first year from which the nation began to recover from the 199091 recession, to 1999, real GSP grew fastest in eight western states and in New Hampshire, Georgia, and North Carolina (see map on page 3). The fast growth in real GSP GSP adjusted to reflect price changes in these states partly reflected strength in business services and in high-tech manufacturing (see discussion on page 2).
For the nation, real GSP grew at an average annual rate of 4.0 percent from 1992 to 1999 (table 2). Real GSP grew in all major industries and was particularly strong in business services and high-tech manufacturing, trade, real estate, security trading, and communications.
States with the fastest growth in real GSP in 199299
The 11 states with the fastest growth in real GSP were Arizona (7.3 percent), Nevada (7.0 percent), Oregon (6.8 percent), Colorado (6.6 percent), Idaho (6.6 percent), New Hampshire (6.3 percent), Utah (6.3 percent), New Mexico (6.2 percent), Georgia (5.8 percent), Texas (5.4 percent), and North Carolina (5.1 percent). Together, these states accounted for about 30 percent of the U.S. growth from 1992 to 1999.
All 11 states were also among those with rapid population growth, above the national average of 1.0 percent per year from 1992 to 1999.
                  --------- Average annual percent change in real GSP in major aggregate industries, 1992-99 --------
                     Total     Agri-                              Transpor-                 Finance,
                     gross    culture,            Cons-    Manu-   tation &  Whole-        insurance,
                     state    forestry,           truc-   factur-  public    sale   Retail  & real     Ser-   Govern-
                   product   & fishing   Mining   tion      ing   utilities  trade   trade   estate    vices    ment
                  ---------------------------------------------------------------------------------------------------
United States ...     4.0       2.1       3.5      4.1      5.0      4.4       6.9     5.8     3.9      3.5      1.0

Arizona .........     7.3       5.0       4.5      7.6     13.2      5.5      11.2     8.3     6.3       6.6     2.7
Nevada ..........     7.0       8.7       4.6     13.8      9.8      8.0      10.4    10.3     6.7       4.9     4.1
Oregon ..........     6.8       5.7       7.3      6.6     16.0      3.9       7.6     6.3     2.8       3.8     2.5
Colorado ........     6.6       5.3       9.0      8.3      5.0     10.5       9.3     8.3     6.8       6.5     1.4
Idaho ...........     6.6       3.4       4.4      5.5     15.6      4.9       8.7     6.5     3.3       4.0     2.7
New Hampshire ...     6.3       3.3       4.5      5.9     11.4      2.6      10.8     7.1     5.3       3.8      .9
Utah ............     6.3       4.6       1.8     10.1      7.0      6.7       9.5     8.9     7.5       5.3     2.1
New Mexico ......     6.2       5.3       7.9      2.6     19.9      3.8       6.4     5.5     3.5       2.6     1.1
Georgia .........     5.8       5.2       8.4      9.3      5.0      6.9       8.6     8.1     4.9       5.9     2.2
Texas ...........     5.4       4.2       1.3      4.8      9.1      6.3       8.9     7.3     4.0       4.8     2.2
North Carolina ..     5.1       1.8      14.2      7.2      3.0      4.0       7.0     6.2     9.4       5.4     2.1
---------------------------------------------------------------------------------------------------------------------
  Note: For the contributions of the industries to the percent change in total gross state product, see table 3.
In all these states except Nevada and Utah, growth was very strong in business services (which includes software development, data processing services, and computer rental and leasing) and in two high-tech manufacturing industries: Electronics and electrical devices (which includes semiconductor manufacturing and related products) and industrial machinery and computer equipment (which includes computer and related hardware manufacturing). In addition:
- In Colorado, Georgia, and Texas, communications (which includes telephone, satellite, and multimedia services) contributed significantly to the growth in real GSP.
- In New Hampshire, Utah, and North Carolina, depository institutions (which includes banks and other financial institutions) contributed significantly.
- In Nevada, hotels and other lodging places contributed significantly, reflecting strength in tourism.
- In New Mexico, oil and gas extraction contributed significantly.
Noticeably absent from the group of western states with rapid growth were California and Washington. In California, which accounts for the largest share (13 percent) of the nation's GSP and has a heavy concentration of high-tech industries, real GSP grew only 3.9 percent, far less than its neighboring fast-growing states. The slow growth in California mainly reflected its longer-than-average recovery from the 199091 recession and weakness in the following industries: Federal government (both military and civilian); defense related durable-goods manufacturing, mainly other transportation equipment; health services; and finance, insurance, and real estate, mainly insurance carriers and depository institutions. In Washington, real GSP grew 4.7 percent; strength in business services, trade, and real estate was partly offset by declines in depository institutions, transportation equipment excluding motor vehicles, lumber and wood products, and printing and publishing.
States with the slowest growth in real GSP in 199299
The 12 states with the slowest growth in real GSP were Hawaii (-0.3 percent), Alaska (0.5 percent), West Virginia (2.4 percent), Wyoming (2.5 percent), North Dakota (2.5 percent), Maine (2.6 percent), Montana (2.7 percent), Pennsylvania (2.8 percent), New Jersey (2.9 percent), Vermont (3.0 percent), Maryland (3.0 percent), and Rhode Island (3.0 percent). Together, these states accounted for less than 10 percent of the U.S. growth in 199299.
Of the 12 slowest growing states, seven were in the eastern part of the nation; all 12 states had population growth below or near the national average of 1.0 percent.
                  --------- Average annual percent change in real GSP in major aggregate industries, 1992-99 --------
                     Total     Agri-                              Transpor-                 Finance,
                     gross    culture,            Cons-    Manu-   tation &  Whole-        insurance,
                     state    forestry,           truc-   factur-  public    sale   Retail  & real     Ser-   Govern-
                   product   & fishing   Mining   tion      ing   utilities  trade   trade   estate    vices    ment
                  ---------------------------------------------------------------------------------------------------
United States ...     4.0       2.1       3.5      4.1      5.0      4.4       6.9     5.8     3.9      3.5      1.0

Hawaii ..........     -.3       -.1        .2     -7.9     -4.3      2.4       2.1     1.6      .1      -.7      -.7
Alaska ..........      .5      -1.1       -.6      2.4      -.8      2.9       5.0     3.8      .7      1.2     -2.1
West Virginia ...     2.4      -1.2       6.5       .9      2.7       .5       4.5     4.2      .8      2.0      2.2
Wyoming .........     2.5       1.1       -.4      5.6      9.4      4.0       8.0     5.1     2.5      2.8       .2
North Dakota ....     2.5      -8.2       6.2      5.1     10.8      2.9       6.2     5.3     1.5      3.2     -1.4
Maine ...........     2.6       3.3     -11.8      1.0      2.4      2.0       5.8     4.9     2.8      2.8      -.2
Montana .........     2.7       -.4       2.2      5.0      3.0      3.2       6.2     4.4     2.1      2.8       .9
Pennsylvania ....     2.8        .9      12.0      1.3      4.4      2.8       5.4     4.4     2.0      1.9       .4
New Jersey ......     2.9       3.9       9.5      1.9       .2      4.1       5.7     4.5     3.6      2.9       .7
Vermont .........     3.0       2.0       1.9      1.1      4.8      1.0       4.2     4.5     2.5      3.0      1.4
Maryland ........     3.0       2.4       8.9      2.3      3.6      3.7       6.3     4.2     2.9      2.9      1.2
Rhode Island ....     3.0       -.4      -3.5      7.8      -.5      3.5       6.0     4.9     4.9      2.0      1.1
---------------------------------------------------------------------------------------------------------------------
  Note: For the contributions of the industries to the percent change in total gross state product, see table 3.
In these 12 states, contributions from business services and high-tech manufacturing were offset by weakness in more traditional industries: Agriculture, forestry, and fishing (mainly farms); manufacturing (mainly food and related products, apparel and textile products, lumber and wood products, printing and publishing, and instruments and scientific products); finance, insurance, and real estate (mainly depository institutions and insurance carriers); services (mainly legal and repair services); and government (mainly federal military and civilian government). In addition:
- In Alaska, Vermont, and Maryland, declines in paper products contributed significantly to the slow growth in real GSP.
- In Alaska, Wyoming, and Montana, declines in oil and gas extraction contributed significantly to the slow growth in real GSP; the declines in oil and gas extraction mainly reflected low crude oil prices in the late 1990s. In Wyoming, nonmetalic minerals also declined.
- In Hawaii, weakness in all major industries contributed to the decline in real GSP. The decline reflected the state's slow recovery from the 199091 recession and impacts from the 1998 Asian financial crisis, which affected growth in tourism, in exportable agriculture-related products, and in the construction industries.
State shares of U.S. current-dollar GSP in 1999
In 1999, current-dollar GSP for the nation was $9.3 trillion. California accounted for the largest share (13.2 percent) of the nation, and its GSP has exceeded $1 trillion since 1997 (see table 4). The other four states with the largest shares of the U.S. total were New York (8.1 percent), Texas (7.4 percent), Illinois (4.8 percent), and Florida (4.8 percent).
The five states with the smallest shares of the U.S. total were Vermont, North Dakota, Wyoming, Montana, and South Dakota; each of these states accounted for about 0.2 percent of the U.S. total.
As a group, the 11 fastest growing states accounted for 20.3 percent of U.S. GSP in 1999, up from 18.1 percent in 1992 (see map on page 3). By comparison, the 12 states with the slowest growth accounted for 12.2 percent in 1999, down from 13.2 percent in 1992.
Sources of GSP revisions
The GSP estimates have been revised for 199398 to incorporate the results of the most recent revisions of state personal income, of the national estimates of gross product by industry, and of the national income and product accounts (NIPA's). The revised GSP estimates also reflect incorporation of the 1997 economic censuses and the 1998 Annual Survey of Manufactures (ASM). The ASM data are based on the North American Industry Classification System (NAICS) rather than on the Standard Industrial Classification System (SIC). For this revision, the 1998 ASM data were converted from NAICS to the SIC by BEA on the basis of information provided by the source agency (see "Industry classification" section below).
In general, the revisions to GSP as a percentage of the previously published estimates for all years are small, with the largest revisions occurring in the most recent years. For the nation, current-dollar GSP was revised down $15.4 billion in 1997, and revised up $7.1 billion in 1998. In 1998, the five states with the largest upward percentage revisions were Alaska (3.2 percentage points), New Mexico (3.1 percentage points), Nevada (1.9 percentage points), Ohio (1.7 percentage points), and Oklahoma (1.7 percentage points).
The revisions in real GSP growth rates tend to be small, with the largest revisions also in the most recent years. In 199798, the five states with the largest revisions in real GSP growth rates were Wyoming (1.6 percentage points), New Hampshire (1.2 percentage points), Rhode Island (-1.3 percentage points), Delaware (-1.4 percentage points), and Iowa (-2.5 percentage points). For a detailed discussion of major sources of the revisions and of the impacts of the revisions, see "Gross State Product by Industry, 199299" in a forthcoming issue of the Survey of Current Business.
Industry classification
In 1997, U.S. federal statistical agencies adopted NAICS an economic classification system that groups establishments into industries based on similarity of production processes. NAICS provides a new framework for collecting, analyzing, and disseminating economic data on an industry basis. Much of BEA's source data, however, remain on a Standard Industrial Classification (SIC) basis. BEA plans to incorporate NAICS into its GSP estimates upon full implementation of NAICS by all of its source-data agencies in 200304. For more information, see "The North American Industry Classification System in BEA's Economic Accounts," Survey of Current Business (May 2001): 713.
Definitions
GSP is the value added in production by the labor and property located in a state. GSP for a state is derived as the sum of the GSP originating in all industries in the state.
The estimates of real GSP are derived by applying national implicit price deflators by detailed industry to the current-dollar GSP estimates by detailed industry. Then, in order to capture the differences across states that reflect the relative differences in the mix of goods and services that the states produce, the same chain-type index formula used in the national accounts is used to calculate the estimates of total real GSP and real GSP by major industry. For additional information, see "BEA's Chain Indexes, Time Series, and Measures of Long-Term Economic Growth," Survey of Current Business 77 (May 1997): 5868; "Comprehensive Revision of Gross State Product by Industry, 197794," Survey 77 (June 1997): 2829; and "Gross State Product by Industry, 197798," Survey 80 (October 2000): 6990.
The 11 "fastest growing states" (and 12 "slow-growing states") were selected because their average annual growth rates in 199299 in real GSP are more than one-half of one standard deviation above (or below) the average annual GSP growth rates for all states.
The relation of GSP to Gross Domestic Product (GDP)
In concept, an industry's GSP, referred to as its "value added," is equivalent to its gross output (sales or receipts and other operating income, commodity taxes, and inventory change) minus its intermediate inputs (consumption of goods and services purchased from other U.S. industries or imported). Thus, GSP is often considered the state counterpart of the nation's GDP BEA's featured measure of U.S. output. In practice, GSP estimates are measured as the sum of the distributions by industry and state of the components of gross domestic income that is, the sum of the costs incurred and incomes earned in the production of GDP.
GSP for the nation differs from GDP for the following reasons: GSP is derived from gross domestic income, which differs from GDP by the statistical discrepancy; GSP excludes and GDP includes the compensation of federal civilian and military personnel stationed abroad and government consumption of fixed capital for military structures located abroad and for military equipment, except office equipment; and GSP and GDP have different revision schedules. In 199299, real GDP grew 3.7 percent per year, and real GSP for the nation grew 4.0 percent per year.
Availability of detailed GSP estimates
GSP estimates for 63 industries for states, BEA regions, and the United States are available on BEA's Web site: www.bea.gov>. The site also contains BEA's major national, regional, international, and industry estimates; the Survey of Current Business; and BEA news releases.
In July 2001, BEA will release a Gross Product by Industry CDROM (product number RCN0281, price $35.00), which contains current-dollar estimates of GSP and its three components compensation of employees, indirect business tax and nontax liability, and property-type income and real GSP estimates in chain-type quantity indexes for 197799 and in chained (1996) dollars for 198699 for the U.S., 50 states, and the District of Columbia. The CDROM includes a data-retrieval program that allows users to view or print selected records from the database and selected analytical tables and charts. Users may also export selected data to a file for importation into computer spreadsheets. For further information, call 202-606-5340, or e-mail gspread@bea.gov>.
STAT-USA maintains an Internet site, which contains BEA estimates, the Survey of Current Business, and BEA news releases. For more information about STAT-USA, go to www.stat-usa.gov>, or call (202) 482-1986. Subscriptions for single-user unlimited access to STAT-USA's Internet information are $75.00 for three months or $175.00 for one year.
Summary BEA estimates are available on recorded messages at the time of public release at the following telephone numbers:
    (202) 606-5306  Gross domestic product
          606-5303  Personal income and outlays
          606-5362  Summary of international transactions
Most of BEA's estimates and analyses are published in the Survey of Current Business, BEA's monthly journal. Subscriptions and single copies are for sale by the Superintendent of Documents, U.S. Government Printing Office. Internet: <bookstore.gpo.gov>; phone: 202-512-1800; fax: 202-512-2250; mail: Stop SSOP, Washington, DC 20402-0001.
State release dates for the rest of 2001:
State Per Capita Personal Income, 2000 (revised) ....... September 24 (Monday)
State Personal Income, Second Quarter 2001 ............. October 24 (Wednesday)
********************************************************************************************************************************************
Table 1. -- Real Gross State Product, 1992-99
[Millions of chained (1996) dollars]
---------------------------------------------------------------------------------------------------------------------------
1992 1993/r/ 1994/r/ 1995/r/ 1996/r/ 1997/r/ 1998/r/ 1999/p/
---------------------------------------------------------------------------------------------------------------------------
United States ............. 6,774,505 6,918,388 7,203,002 7,433,965 7,715,901 8,093,396 8,507,978 8,934,066
New England ............. 391,385 397,470 410,014 422,524 439,596 463,498 489,127 520,092
Connecticut ........... 114,830 115,725 117,489 120,792 124,157 132,620 138,749 145,274
Maine ................. 27,046 27,286 27,755 28,256 28,925 29,958 31,062 32,306
Massachusetts ......... 182,789 186,680 195,171 200,537 210,127 219,716 233,572 251,861
New Hampshire ......... 28,373 28,808 30,122 32,630 35,068 37,131 40,702 43,469
Rhode Island .......... 24,884 25,226 25,385 26,182 26,656 28,766 29,201 30,631
Vermont ............... 13,524 13,794 14,115 14,133 14,662 15,304 15,864 16,592
Mideast ................. 1,355,899 1,369,966 1,398,474 1,427,110 1,471,796 1,517,005 1,584,251 1,657,630
Delaware .............. 25,639 25,984 26,657 28,236 29,001 30,142 31,691 31,879
District of Columbia .. 50,646 51,216 50,657 49,737 48,505 49,265 49,691 51,823
Maryland .............. 133,947 136,070 140,338 142,140 145,061 151,478 157,884 164,841
New Jersey ............ 258,156 262,674 268,019 275,002 285,738 294,088 304,806 315,425
New York .............. 586,798 587,982 600,674 609,090 633,830 651,107 688,143 728,908
Pennsylvania .......... 300,806 306,134 312,197 322,915 329,660 340,924 352,063 364,899
Great Lakes ............. 1,082,441 1,113,225 1,176,832 1,206,844 1,243,554 1,300,504 1,361,157 1,411,524
Illinois .............. 328,462 334,735 353,302 364,080 375,949 394,497 413,024 429,496
Indiana ............... 133,621 138,501 145,882 150,037 155,096 161,059 171,628 176,019
Michigan .............. 226,548 237,214 255,812 258,329 265,130 275,991 283,817 295,623
Ohio .................. 271,844 276,024 290,068 299,232 306,333 322,050 337,674 348,890
Wisconsin ............. 121,928 126,748 131,788 135,169 141,046 146,903 155,018 161,499
Plains .................. 449,786 451,991 478,541 493,438 516,213 541,882 562,785 582,413
Iowa .................. 66,147 66,324 71,576 73,111 76,976 81,541 82,388 84,029
Kansas ................ 61,872 62,367 65,016 65,618 68,160 72,113 75,018 78,025
Minnesota ............. 122,706 123,146 130,178 133,804 141,540 150,415 158,434 167,110
Missouri .............. 127,157 127,578 135,048 141,926 146,537 153,392 158,757 162,941
Nebraska .............. 41,308 41,376 44,009 45,247 47,772 48,924 50,650 52,240
North Dakota .......... 14,016 13,795 14,627 14,988 15,855 15,819 16,867 16,681
South Dakota .......... 16,603 17,429 18,097 18,744 19,372 19,673 20,642 21,331
Southeast ............... 1,436,937 1,485,361 1,564,909 1,625,905 1,684,304 1,761,146 1,840,770 1,916,948
Alabama ............... 88,853 90,225 93,575 96,624 99,286 102,646 105,651 110,127
Arkansas .............. 48,652 50,174 52,921 54,689 56,796 58,585 60,268 62,821
Florida ............... 314,129 325,760 339,110 350,565 366,318 382,250 401,901 420,323
Georgia ............... 175,614 183,173 195,330 206,415 219,520 231,808 246,620 260,754
Kentucky .............. 81,890 84,543 89,569 92,794 95,536 100,210 104,237 107,499
Louisiana ............. 100,696 102,847 110,509 116,496 116,867 120,699 123,618 124,444
Mississippi ........... 47,963 49,925 53,020 55,420 56,575 57,794 59,639 61,885
North Carolina ........ 170,297 176,163 188,574 197,500 204,329 218,108 227,546 240,771
South Carolina ........ 77,984 80,440 84,567 87,750 89,854 94,252 98,214 102,254
Tennessee ............. 121,959 127,108 134,440 138,632 142,051 149,239 156,398 161,731
Virginia .............. 175,916 181,231 187,578 192,486 199,953 207,892 218,436 225,132
West Virginia ......... 33,033 33,813 35,723 36,569 37,220 37,668 38,199 39,060
Southwest ............... 648,217 676,768 714,828 747,594 785,031 844,386 899,345 944,501
Arizona ............... 85,316 89,911 98,339 105,397 112,882 120,763 131,253 140,084
New Mexico ............ 34,081 37,795 42,183 42,708 44,114 47,621 50,251 51,874
Oklahoma .............. 67,641 69,173 70,081 71,819 74,855 78,111 81,652 84,038
Texas ................. 461,434 480,045 504,252 527,685 553,180 597,889 636,179 668,462
Rocky Mountain .......... 185,854 196,568 208,044 219,072 230,695 245,237 260,940 277,893
Colorado .............. 94,035 99,789 105,850 111,244 117,118 127,314 136,942 147,049
Idaho ................. 21,783 23,654 25,331 27,395 28,101 29,322 31,196 34,054
Montana ............... 16,577 17,245 17,679 17,858 18,074 18,614 19,344 19,951
Utah .................. 39,024 40,932 43,952 46,965 51,523 53,999 56,919 59,663
Wyoming ............... 14,486 14,990 15,264 15,617 15,879 15,983 16,526 17,180
Far West ................ 1,224,376 1,227,133 1,251,258 1,291,429 1,344,712 1,419,778 1,509,795 1,623,462
Alaska ................ 25,130 25,438 25,268 26,355 25,774 26,056 25,348 25,932
California ............ 906,189 898,829 911,249 941,853 973,395 1,029,232 1,096,584 1,185,636
Hawaii ................ 39,120 38,809 38,332 37,948 37,490 37,668 37,858 38,254
Nevada ................ 40,266 43,019 47,030 50,062 54,564 57,518 60,994 64,622
Oregon ................ 69,392 73,009 76,642 81,330 91,709 97,097 103,691 110,092
Washington ............ 144,389 148,188 152,882 153,987 161,779 172,216 185,311 198,928
---------------------------------------------------------------------------------------------------------------------------
r Revised.
p Preliminary.
Note: Chained (1996) dollar series are calculated (using national chain-type implicit price deflators) as the product of
the chain-type quantity index and the 1996 current-dollar value of the corresponding series, divided by 100. Because the
formula for the chain-type quantity indexes uses weights of more than one period, the corresponding chained-dollar
estimates are usually not additive; that is, state totals usually do not add to regional totals or to U.S. totals, and
regional totals usually do not add to U.S. totals.
Source: U.S. Bureau of Economic Analysis
****************************************************************************************************************************************
Table 2. -- Average Annual Percent Change in Real Gross State Product by Major Industry, 1992-99
-----------------------------------------------------------------------------------------------------------------------------------------------
Rank
of
Total Agri- Trans- Finance percent
gross culture, Mining Con- Manu- portation Whole- Retail insur- Ser- Govern- change
state forestry, struc- factur- and sale trade ance, vices ment in total
product and tion ing public trade and real gross
fishing utilities estate state
product
-----------------------------------------------------------------------------------------------------------------------------------------------
United States ............. 4.0 2.1 3.5 4.1 5.0 4.4 6.9 5.8 3.9 3.5 1.0 .......
New England ............. 4.1 2.6 2.3 4.9 4.9 2.5 7.2 5.5 4.8 3.4 1.1 .......
Connecticut ........... 3.4 3.3 8.5 1.1 3.8 2.3 5.2 5.0 4.1 3.2 .4 31
Maine ................. 2.6 3.3 -11.8 1.0 2.4 2.0 5.8 4.9 2.8 2.8 -.2 45
Massachusetts ......... 4.7 2.3 -1.1 7.5 5.2 2.7 8.2 5.7 5.5 3.7 1.9 12
New Hampshire ......... 6.3 3.3 4.5 5.9 11.4 2.6 10.8 7.1 5.3 3.8 .9 6
Rhode Island .......... 3.0 -.4 -3.5 7.8 -.5 3.5 6.0 4.9 4.9 2.0 1.1 39
Vermont ............... 3.0 2.0 1.9 1.1 4.8 1.0 4.2 4.5 2.5 3.0 1.4 41
Mideast ................. 2.9 2.1 10.3 1.6 2.0 3.1 5.3 4.4 4.4 2.1 .4 .......
Delaware .............. 3.2 3.4 -12.0 4.2 -.6 3.5 6.7 5.9 3.6 4.2 2.4 34
District of Columbia .. .3 1.7 12.2 -3.0 -2.7 1.4 2.4 1.6 1.4 1.7 -1.2 .......
Maryland .............. 3.0 2.4 8.9 2.3 3.6 3.7 6.3 4.2 2.9 2.9 1.2 40
New Jersey ............ 2.9 3.9 9.5 1.9 .2 4.1 5.7 4.5 3.6 2.9 .7 42
New York .............. 3.1 2.3 4.9 1.3 .9 2.7 4.7 4.4 5.8 1.7 .3 36
Pennsylvania .......... 2.8 .9 12.0 1.3 4.4 2.8 5.4 4.4 2.0 1.9 .4 43
Great Lakes ............. 3.9 .3 2.8 4.0 4.9 3.6 6.7 5.7 3.0 3.2 1.0 .......
Illinois .............. 3.9 -2.2 .8 2.7 5.0 4.1 5.8 4.9 3.8 3.6 1.4 22
Indiana ............... 4.0 -1.7 6.6 3.6 5.9 2.4 7.0 5.7 2.4 3.0 1.0 18
Michigan .............. 3.9 3.4 -2.8 6.8 4.4 4.3 7.6 6.8 1.6 3.5 .3 23
Ohio .................. 3.6 .4 8.1 4.1 4.6 2.5 7.1 5.7 3.0 2.3 1.0 27
Wisconsin ............. 4.1 2.2 .5 3.2 5.4 4.1 7.0 6.1 3.0 3.5 1.0 17
Plains .................. 3.8 -2.1 3.7 4.4 4.2 4.5 6.9 5.9 3.5 3.5 1.1 .......
Iowa .................. 3.5 -4.1 5.8 3.3 5.0 4.9 7.1 4.9 2.5 3.1 1.3 30
Kansas ................ 3.4 -1.3 2.0 4.7 3.2 5.9 7.0 6.1 1.5 2.9 1.0 33
Minnesota ............. 4.5 .6 7.5 4.4 4.6 4.7 7.8 6.5 4.9 4.0 1.2 14
Missouri .............. 3.6 -1.2 3.5 4.8 2.9 3.6 6.1 5.8 3.8 3.3 1.9 28
Nebraska .............. 3.4 -2.9 -3.5 5.4 4.7 4.9 5.9 5.7 3.0 4.2 .6 32
North Dakota .......... 2.5 -8.2 6.2 5.1 10.8 2.9 6.2 5.3 1.5 3.2 -1.4 46
South Dakota .......... 3.6 .1 -4.5 2.9 10.4 3.8 7.3 6.0 1.9 3.4 -.2 26
Southeast ............... 4.2 2.7 6.2 5.2 3.2 4.5 7.7 6.4 4.5 4.3 1.3 .......
Alabama ............... 3.1 5.2 8.6 4.1 1.9 2.3 6.9 5.9 4.6 2.4 .6 37
Arkansas .............. 3.7 3.6 3.8 5.0 4.0 2.8 7.4 6.9 2.6 2.5 1.5 24
Florida ............... 4.2 3.3 .8 4.3 3.2 4.8 8.2 6.3 4.1 4.0 1.4 15
Georgia ............... 5.8 5.2 8.4 9.3 5.0 6.9 8.6 8.1 4.9 5.9 2.2 9
Kentucky .............. 4.0 -1.2 5.3 3.7 5.5 3.8 8.2 6.1 2.2 3.3 .9 19
Louisiana ............. 3.1 1.9 7.0 2.2 3.0 1.9 5.8 5.8 1.8 2.2 .7 38
Mississippi ........... 3.7 5.4 2.2 6.6 2.5 1.5 6.9 6.3 2.2 5.8 2.5 25
North Carolina ........ 5.1 1.8 14.2 7.2 3.0 4.0 7.0 6.2 9.4 5.4 2.1 11
South Carolina ........ 3.9 3.5 2.2 6.1 2.3 6.1 8.9 7.0 3.9 4.3 .6 20
Tennessee ............. 4.1 -.9 4.3 5.4 3.0 5.1 7.7 6.7 4.6 3.8 1.3 16
Virginia .............. 3.6 .6 5.5 3.7 1.6 5.5 7.6 5.8 3.7 5.3 .3 29
West Virginia ......... 2.4 -1.2 6.5 .9 2.7 .5 4.5 4.2 .8 2.0 2.2 48
Southwest ............... 5.5 4.1 2.1 5.2 9.8 5.7 8.8 7.1 4.2 4.8 2.0 .......
Arizona ............... 7.3 5.0 4.5 7.6 13.2 5.5 11.2 8.3 6.3 6.6 2.7 1
New Mexico ............ 6.2 5.3 7.9 2.6 19.9 3.8 6.4 5.5 3.5 2.6 1.1 8
Oklahoma .............. 3.1 2.6 3.0 5.3 4.6 2.7 5.2 5.2 1.8 3.2 .5 35
Texas ................. 5.4 4.2 1.3 4.8 9.1 6.3 8.9 7.3 4.0 4.8 2.2 10
Rocky Mountain .......... 5.9 3.4 2.4 7.9 7.5 8.0 9.0 7.7 6.0 5.6 1.6 .......
Colorado .............. 6.6 5.3 9.0 8.3 5.0 10.5 9.3 8.3 6.8 6.5 1.4 4
Idaho ................. 6.6 3.4 4.4 5.5 15.6 4.9 8.7 6.5 3.3 4.0 2.7 5
Montana ............... 2.7 -.4 2.2 5.0 3.0 3.2 6.2 4.4 2.1 2.8 .9 44
Utah .................. 6.3 4.6 1.8 10.1 7.0 6.7 9.5 8.9 7.5 5.3 2.1 7
Wyoming ............... 2.5 1.1 -.4 5.6 9.4 4.0 8.0 5.1 2.5 2.8 .2 47
Far West ................ 4.1 3.8 3.4 3.6 8.1 5.4 6.3 5.4 2.7 3.6 .6 .......
Alaska ................ .5 -1.1 -.6 2.4 -.8 2.9 5.0 3.8 .7 1.2 -2.1 49
California ............ 3.9 4.1 7.2 3.2 8.0 5.5 6.1 5.1 2.5 3.1 .2 21
Hawaii ................ -.3 -.1 .2 -7.9 -4.3 2.4 2.1 1.6 .1 -.7 -.7 50
Nevada ................ 7.0 8.7 4.6 13.8 9.8 8.0 10.4 10.3 6.7 4.9 4.1 2
Oregon ................ 6.8 5.7 7.3 6.6 16.0 3.9 7.6 6.3 2.8 3.8 2.5 3
Washington ............ 4.7 1.6 5.2 2.3 3.2 6.2 6.4 6.4 3.7 7.6 1.5 13
-----------------------------------------------------------------------------------------------------------------------------------------------
Source: U.S. Bureau of Economic Analysis
*****************************************************************************************************************************************
Table 3. -- Contributions to Percent Change in Real Gross State Product, 1992-99
-----------------------------------------------------------------------------------------------------------------------------------------
Average Percentage points
annual -------------------------------------------------------------------------------------------------
percent Agri- Trans- Finance
change culture, Mining Con- Manu- portation Whole- Retail insur- Ser- Govern-
in total forestry, struc- factur- and sale trade ance, vices ment
gross and tion ing public trade and real
state fishing utilities estate
product
-----------------------------------------------------------------------------------------------------------------------------------------
United States ............. 4.0 0.03 0.05 0.17 0.84 0.38 0.47 0.52 0.73 0.72 0.13
New England ............. 4.1 .02 0 .17 .82 .16 .47 .46 1.13 .79 .12
Connecticut ........... 3.4 .02 .01 .04 .68 .15 .34 .39 1.10 .66 .04
Maine ................. 2.6 .07 0 .04 .40 .15 .34 .58 .50 .53 -.03
Massachusetts ......... 4.7 .01 0 .26 .80 .17 .58 .45 1.28 .96 .18
New Hampshire ......... 6.3 .03 0 .22 2.49 .17 .65 .69 1.19 .76 .08
Rhode Island .......... 3.0 0 0 .33 -.07 .24 .31 .44 1.19 .43 .14
Vermont ............... 3.0 .05 .01 .05 .92 .08 .24 .42 .42 .61 .17
Mideast ................. 2.9 .01 .02 .06 .27 .25 .34 .33 1.09 .49 .05
Delaware .............. 3.2 .03 0 .16 -.10 .18 .26 .41 1.38 .61 .22
District of Columbia .. .3 0 0 -.03 -.07 .07 .03 .04 .17 .56 -.46
Maryland .............. 3.0 .02 .01 .12 .30 .28 .38 .38 .61 .67 .23
New Jersey ............ 2.9 .02 .01 .07 .03 .39 .52 .34 .81 .64 .07
New York .............. 3.1 .01 0 .04 .10 .21 .29 .31 1.76 .39 .03
Pennsylvania .......... 2.8 .01 .07 .05 .86 .25 .33 .39 .36 .43 .04
Great Lakes ............. 3.9 0 .01 .17 1.20 .29 .47 .51 .49 .61 .11
Illinois .............. 3.9 -.02 0 .12 .86 .39 .47 .41 .76 .78 .15
Indiana ............... 4.0 -.02 .03 .17 1.81 .20 .41 .51 .32 .48 .11
Michigan .............. 3.9 .03 -.01 .28 1.18 .29 .54 .63 .24 .66 .04
Ohio .................. 3.6 0 .03 .16 1.23 .20 .48 .54 .45 .42 .11
Wisconsin ............. 4.1 .05 0 .14 1.45 .30 .44 .55 .46 .60 .11
Plains .................. 3.8 -.08 .02 .19 .80 .43 .52 .55 .53 .65 .14
Iowa .................. 3.5 -.22 .01 .13 1.18 .40 .52 .44 .36 .49 .16
Kansas ................ 3.4 -.05 .03 .19 .56 .70 .53 .59 .20 .48 .14
Minnesota ............. 4.5 .01 .04 .20 .88 .36 .62 .60 .85 .80 .13
Missouri .............. 3.6 -.02 .01 .21 .60 .37 .45 .55 .56 .65 .22
Nebraska .............. 3.4 -.20 -.01 .22 .68 .51 .46 .48 .44 .74 .09
North Dakota .......... 2.5 -.60 .21 .23 .81 .30 .53 .50 .20 .55 -.21
South Dakota .......... 3.6 .01 -.04 .11 1.28 .32 .48 .61 .35 .55 -.02
Southeast ............... 4.2 .05 .09 .23 .58 .41 .52 .63 .70 .81 .19
Alabama ............... 3.1 .11 .11 .17 .39 .21 .43 .58 .61 .40 .10
Arkansas .............. 3.7 .15 .03 .20 .94 .31 .46 .75 .30 .39 .19
Florida ............... 4.2 .06 0 .20 .26 .42 .60 .71 .86 .95 .18
Georgia ............... 5.8 .08 .04 .38 .89 .79 .77 .73 .75 1.08 .29
Kentucky .............. 4.0 -.03 .15 .16 1.45 .32 .47 .56 .25 .51 .13
Louisiana ............. 3.1 .02 .72 .10 .49 .19 .33 .51 .24 .37 .09
Mississippi ........... 3.7 .15 .02 .26 .56 .16 .39 .65 .25 .87 .40
North Carolina ........ 5.1 .04 .02 .31 .79 .31 .45 .57 1.45 .85 .29
South Carolina ........ 3.9 .04 0 .31 .57 .51 .51 .73 .51 .66 .11
Tennessee ............. 4.1 -.01 .01 .21 .69 .42 .56 .73 .61 .74 .16
Virginia .............. 3.6 .01 .03 .16 .23 .48 .41 .49 .62 1.08 .07
West Virginia ......... 2.4 -.01 .53 .04 .42 .06 .24 .40 .09 .33 .32
Southwest ............... 5.5 .07 .12 .23 1.43 .58 .62 .68 .62 .92 .26
Arizona ............... 7.3 .08 .05 .40 1.90 .43 .70 .88 1.16 1.38 .36
New Mexico ............ 6.2 .12 .64 .10 3.07 .30 .27 .52 .47 .49 .21
Oklahoma .............. 3.1 .07 .15 .17 .82 .26 .31 .52 .22 .55 .09
Texas ................. 5.4 .06 .09 .21 1.29 .68 .67 .68 .58 .91 .26
Rocky Mountain .......... 5.9 .09 .09 .42 .91 .85 .54 .75 .92 1.11 .24
Colorado .............. 6.6 .09 .14 .44 .58 1.18 .58 .81 1.15 1.44 .20
Idaho ................. 6.6 .22 .03 .34 2.96 .40 .54 .67 .41 .65 .38
Montana ............... 2.7 -.02 .10 .23 .23 .38 .38 .44 .28 .52 .15
Utah .................. 6.3 .06 .05 .54 .96 .60 .58 .91 1.14 1.08 .34
Wyoming ............... 2.5 .03 -.11 .24 .50 .57 .28 .36 .26 .30 .02
Far West ................ 4.1 .08 .03 .15 1.11 .40 .41 .50 .55 .81 .07
Alaska ................ .5 -.02 -.11 .08 -.03 .39 .12 .21 .06 .12 -.36
California ............ 3.9 .08 .04 .12 1.14 .39 .40 .47 .55 .70 .03
Hawaii ................ -.3 0 0 -.41 -.13 .24 .08 .17 .02 -.14 -.14
Nevada ................ 7.0 .06 .14 1.06 .38 .65 .47 1.02 1.11 1.63 .46
Oregon ................ 6.8 .17 .01 .32 3.42 .30 .58 .56 .44 .68 .33
Washington ............ 4.7 .04 .01 .11 .44 .48 .46 .63 .66 1.64 .22
-----------------------------------------------------------------------------------------------------------------------------------------
Source: U.S. Bureau of Economic Analysis
********************************************************************************************************************************************
Table 4. -- Gross State Product in Current Dollars, 1992-99
[Millions of dollars]
----------------------------------------------------------------------------------------------------------------------------------------------------
Percentage of U.S.total
1992 1993/r/ 1994/r/ 1995/r/ 1996/r/ 1997/r/ 1998/r/ 1999/p/ -----------------------
1992 1999
----------------------------------------------------------------------------------------------------------------------------------------------------
United States ............. 6,209,096 6,513,026 6,930,791 7,309,516 7,715,901 8,224,960 8,752,363 9,308,983 100.0 100.0
New England ............. 357,145 373,298 394,406 416,166 439,596 471,336 504,155 542,347 5.8 5.8
Connecticut ........... 103,794 107,924 112,395 118,645 124,157 134,968 143,191 151,779 1.7 1.6
Maine ................. 24,397 25,358 26,501 27,987 28,925 30,409 32,138 34,064 .4 .4
Massachusetts ......... 167,334 175,729 188,000 197,469 210,127 223,571 240,898 262,564 2.7 2.8
New Hampshire ......... 26,396 27,507 29,410 32,388 35,068 37,470 41,229 44,229 .4 .5
Rhode Island .......... 22,656 23,627 24,352 25,703 26,656 29,409 30,468 32,546 .4 .3
Vermont ............... 12,570 13,154 13,747 13,974 14,662 15,510 16,233 17,164 .2 .2
Mideast ................. 1,234,406 1,282,906 1,341,317 1,403,270 1,471,796 1,547,124 1,642,652 1,734,325 19.9 18.6
Delaware .............. 23,069 23,827 25,122 27,575 29,001 31,263 33,912 34,669 .4 .4
District of Columbia .. 44,458 46,596 47,484 48,408 48,505 50,546 52,175 55,832 .7 .6
Maryland .............. 120,734 126,442 133,952 139,495 145,061 154,646 164,287 174,710 1.9 1.9
New Jersey ............ 235,456 246,727 258,079 271,435 285,738 299,986 316,467 331,544 3.8 3.6
New York .............. 535,341 551,161 575,585 597,593 633,830 663,377 710,897 754,590 8.6 8.1
Pennsylvania .......... 275,349 288,154 301,096 318,765 329,660 347,306 364,914 382,980 4.4 4.1
Great Lakes ............. 996,218 1,052,019 1,138,906 1,191,441 1,243,554 1,317,428 1,397,473 1,464,641 16.0 15.7
Illinois .............. 303,238 317,248 342,322 359,451 375,949 400,327 424,756 445,666 4.9 4.8
Indiana ............... 123,604 131,485 141,735 148,447 155,096 162,953 176,095 182,202 2.0 2.0
Michigan .............. 206,666 222,886 246,812 254,179 265,130 279,503 291,557 308,310 3.3 3.3
Ohio .................. 250,363 260,891 280,850 295,668 306,333 326,451 346,778 361,981 4.0 3.9
Wisconsin ............. 112,347 119,508 127,187 133,694 141,046 148,194 158,286 166,481 1.8 1.8
Plains .................. 410,814 424,025 459,515 484,013 516,213 547,790 575,947 601,905 6.6 6.5
Iowa .................. 61,104 62,764 69,169 71,687 76,976 81,695 83,094 85,243 1.0 .9
Kansas ................ 56,338 58,380 62,206 64,069 68,160 72,998 76,796 80,843 .9 .9
Minnesota ............. 111,908 115,420 125,017 131,841 141,540 152,334 162,478 172,982 1.8 1.9
Missouri .............. 115,993 119,680 129,957 139,547 146,537 155,811 163,949 170,470 1.9 1.8
Nebraska .............. 37,593 38,665 42,032 44,084 47,772 49,275 51,702 53,744 .6 .6
North Dakota .......... 12,740 12,855 13,895 14,529 15,855 15,910 17,031 16,991 .2 .2
South Dakota .......... 15,137 16,261 17,240 18,257 19,372 19,767 20,898 21,631 .2 .2
Southeast ............... 1,320,694 1,400,329 1,504,102 1,599,405 1,684,304 1,791,586 1,903,691 2,023,742 21.3 21.7
Alabama ............... 81,115 84,497 89,740 95,514 99,286 104,213 108,950 115,071 1.3 1.2
Arkansas .............. 44,610 47,188 50,921 53,809 56,796 59,141 61,626 64,773 .7 .7
Florida ............... 285,518 305,036 325,556 344,771 366,318 389,473 416,422 442,895 4.6 4.8
Georgia ............... 160,814 172,220 187,645 203,505 219,520 235,733 255,455 275,719 2.6 3.0
Kentucky .............. 76,726 80,882 86,905 91,472 95,536 101,535 107,571 113,539 1.2 1.2
Louisiana ............. 91,243 95,587 104,055 112,157 116,867 123,549 125,311 128,959 1.5 1.4
Mississippi ........... 44,222 47,384 51,358 54,562 56,575 58,743 61,417 64,286 .7 .7
North Carolina ........ 159,977 168,830 182,234 194,634 204,329 221,629 236,472 258,592 2.6 2.8
South Carolina ........ 71,934 75,955 81,515 86,880 89,854 95,447 101,214 106,917 1.2 1.1
Tennessee ............. 111,844 119,758 129,671 136,821 142,051 151,738 161,835 170,085 1.8 1.8
Virginia .............. 161,790 170,754 179,727 188,963 199,953 212,105 227,997 242,221 2.6 2.6
West Virginia ......... 30,901 32,240 34,774 36,315 37,220 38,281 39,423 40,685 .5 .4
Southwest ............... 598,584 640,277 687,205 730,598 785,031 858,147 910,977 968,362 9.6 10.4
Arizona ............... 79,000 85,483 95,747 104,586 112,882 122,273 133,509 143,683 1.3 1.5
New Mexico ............ 32,858 37,110 41,772 42,170 44,114 47,829 49,223 51,026 .5 .5
Oklahoma .............. 62,013 65,035 66,979 69,960 74,855 79,423 83,022 86,382 1.0 .9
Texas ................. 424,713 452,649 482,707 513,882 553,180 608,622 645,223 687,272 6.8 7.4
Rocky Mountain .......... 170,508 185,006 200,012 214,923 230,695 249,183 267,647 288,479 2.7 3.1
Colorado .............. 85,844 93,588 101,531 109,021 117,118 129,575 141,056 153,728 1.4 1.7
Idaho ................. 20,354 22,758 24,893 27,155 28,101 29,388 31,236 34,025 .3 .4
Montana ............... 15,084 16,151 16,952 17,537 18,074 18,907 19,881 20,636 .2 .2
Utah .................. 35,671 38,395 42,236 46,290 51,523 55,070 58,997 62,641 .6 .7
Wyoming ............... 13,555 14,114 14,400 14,920 15,879 16,244 16,477 17,448 .2 .2
Far West ................ 1,120,726 1,155,166 1,205,328 1,269,700 1,344,712 1,442,365 1,549,820 1,685,181 18.0 18.1
Alaska ................ 22,372 23,014 23,104 24,791 25,774 26,575 25,008 26,353 .4 .3
California ............ 831,576 847,879 879,041 925,931 973,395 1,045,254 1,125,559 1,229,098 13.4 13.2
Hawaii ................ 35,549 36,308 36,766 37,243 37,490 38,537 39,610 40,914 .6 .4
Nevada ................ 36,480 39,929 45,022 49,377 54,564 59,248 64,260 69,864 .6 .8
Oregon ................ 64,129 69,810 75,087 81,092 91,709 97,510 103,549 109,694 1.0 1.2
Washington ............ 130,620 138,225 146,308 151,265 161,779 175,242 191,834 209,258 2.1 2.2
----------------------------------------------------------------------------------------------------------------------------------------------------
r Revised.
p Preliminary.
Note: Estimates may not add to totals due to rounding.
Source: U.S. Bureau of Economic Analysis
********************************************************************************************************************************************