
News Release
State Personal Income: Third Quarter 2001

| Andy Bernat: | (202) | 6069235 | (Analysis) | BEA 0201 |
| Marian Sacks: | 6069274 | (Estimates) | ||
| Data requests: | 6065360 | (Regional Economic Information System) | ||
| E-mail inquiries: | RegRelease@bea.gov |
Most states experienced weak personal income growth in the third quarter of 2001, primarily reflecting the continued slowing of personal income since late 2000 and the effects of the terrorist attacks of September 11 (see box for details), according to the Bureau of Economic Analysis of the U.S. Department of Commerce.
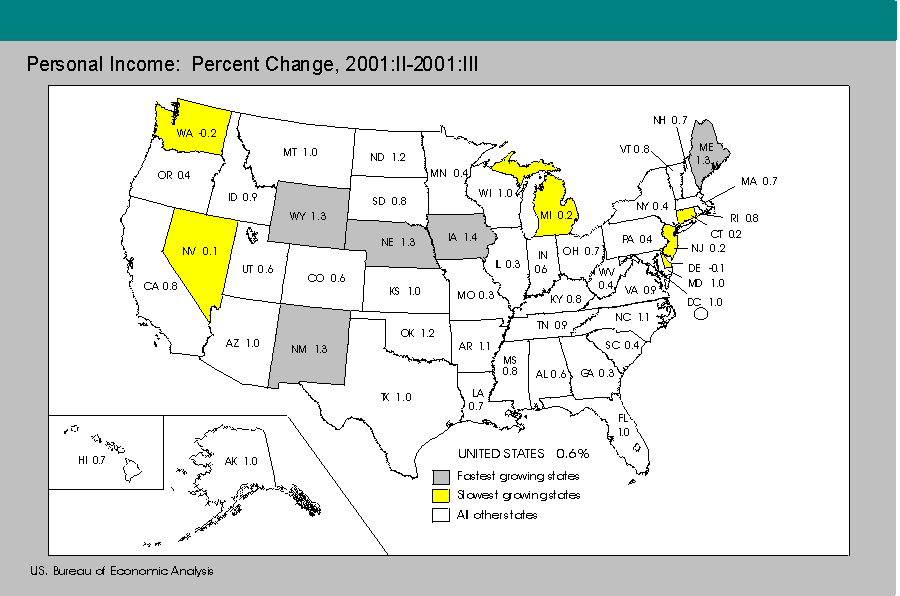
In thirty-three states, personal income increased less than 1.0 percent (table 1). Personal income decreased slightly in Washington and Delaware and increased only 1.4 percent in Iowa, the fastest growing state. As a result, the difference between the growth rates in the fastest and slowest growing states was 1.6 percentage points the smallest in 20 years.
Personal income growth decelerated in 28 states and the District of Columbia, following weak second-quarter growth. In 19 other states, personal income growth accelerated slightly.
The contribution of the three major components to third-quarter growth varied among states, but differences in growth rates among states were due largely to differences in growth of net earnings because net earnings accounts for at least 60 percent of personal income in every state (table 2). Thirty-four states experienced modest growth in dividends, interest, and rent, in contrast to the second quarter when only Georgia and California experienced such growth. The growth rate of dividends, interest, and rent exceeded that of total personal income in five states (Texas, Louisiana, Georgia, Delaware, and Washington). Transfer payments increased in all states, but growth in transfers had a relatively minor effect on personal income growth.
States with the slowest growth in personal income
In the third quarter of 2001, the six states with the slowest growth in personal income were Washington (-0.2 percent), Delaware (-0.1 percent), Nevada (0.1 percent), Connecticut (0.2 percent), New Jersey (0.2 percent), and Michigan (0.2 percent). As a group, these six states accounted for 12.1 percent of U.S. personal income and contributed only 2.5 percent of the $56.4 billion of U.S. growth.
                                       States with the slowest growth in personal income in 2001:III

-----------------------------------------------------------------------------------------------------------------------------------
                   ----------- Personal income ---------------- -----------Type of income-------------  ------- Percent of --------
                    2000                2001
                   ------   ---------------------------------                                              U.S.       Growth in
                     IV         I        II        III                    Dividends,     Transfer        Personal     U.S. personal
                                                                   Net     interest,      pay-           income,       income,
                                                                 earnings    & rent      ments           2001:III      2001:III
                   --- percent change from previous quarter --- ---percent change, 2001:II-2001:III---  ---------------------------

 UNITED STATES ...    1.6      1.4       0.8       0.6              0.6        0.2        1.7               100           100

 Washington ......    2.0     -0.6       4.1      -0.2             -0.6          0        2.1               2.2          -0.6
 Delaware ........    2.7     -0.2       2.3      -0.1             -0.4          0        1.6               0.3             0
 Nevada ..........    1.5      2.3       1.9       0.1             -0.1          0        2.3               0.7           0.1
 Connecticut .....    1.8      2.4       0.3       0.2                0          0        1.7               1.7           0.5
 New Jersey ......    2.9     -0.2       1.1       0.2                0        0.1        1.7               3.7           1.3
 Michigan ........    0.9      0.6       1.4       0.2                0        0.1        1.3               3.4           1.2
-----------------------------------------------------------------------------------------------------------------------------------
 Note.-- Percent changes are expressed at quarterly rates.
By industry, the major contributors to the relatively slow growth in earnings by place of work in the slowest-growing states were:
- In Washington, services (primarily software-related) contributed the most to the decline in earnings, as growth returned to a more normal rate of increase after unusually large lump-sum payments boosted growth in the second quarter.
- In Delaware, earnings in construction, nondurables manufacturing (primarily chemicals) and in durables manufacturing (primarily automobiles) contributed the most to the decline in earnings.
- In Nevada, earnings growth in most industries were below the national average, with transportation and public utilities and construction contributing the most to weak earnings growth.
- In Connecticut, earnings in construction and durables manufacturing contributed to weak earnings growth.
- In New Jersey, earnings growth in most industries was below average, with construction and manufacturing (primarily nondurables) contributing the most to weak earnings growth.
- In Michigan, earnings in manufacturing (primarily durables) and construction contributed the most to weak earnings growth.
States with the fastest growth in personal income
In the third quarter of 2001, the five states with the fastest growth in personal income were Iowa (1.4 percent), Nebraska (1.3 percent), Maine (1.3 percent), Wyoming (1.3 percent), and New Mexico (1.3 percent). As is frequently the case, the fastest growing states were relatively small, accounting for 2.5 percent of U.S. personal income, and contributing 5.2 percent of the $56.4 billion of U.S. growth.
                                   States with the fastest growth in personal income in 2001:III

-----------------------------------------------------------------------------------------------------------------------------------
                   ----------- Personal income ---------------- -----------Type of income-------------  ------- Percent of --------
                    2000                2001
                   ------   ---------------------------------                                              U.S.       Growth in
                     IV         I        II        III                    Dividends,     Transfer        Personal     U.S. personal
                                                                   Net     interest,      pay-           income,       income,
                                                                 earnings    & rent      ments           2001:III      2001:III
                   --- percent change from previous quarter --- ---percent change, 2001:II-2001:III---  ---------------------------

 UNITED STATES ...    1.6      1.4       0.8       0.6              0.6        0.2        1.7               100           100

 Iowa.............    0.5      1.5       0.8       1.4              1.8          0        1.6               0.9           2.0
 Nebraska ........    0.1      0.5       1.1       1.3              1.6        0.1        1.9               0.6           1.1
 Maine ...........    1.4      3.2       0.7       1.3              1.4        0.1        1.8               0.4           0.8
 Wyoming .........    2.9      0.2       2.1       1.3              1.5        0.4        1.6               0.2           0.3
 New Mexico.......    1.6      1.9       1.7       1.3              1.4        0.1        2.1               0.5           0.9
-----------------------------------------------------------------------------------------------------------------------------------
 Note.-- Percent changes are expressed at quarterly rates.
By industry, the major contributors to earnings by place of work in the fastest-growing states were:
- In Iowa, earnings grew faster than average in most industries, with services and farms making the largest contributions to earnings growth.
- In Nebraska, services and nondurables manufacturing contributed the most to earnings growth.
- In Maine, government and services contributed the most to earnings growth.
- In Wyoming, government and construction contributed the most to earnings growth.
- In New Mexico, services, government, and farms contributed the most to earnings growth.
Adjustments to State Personal Income for the September 11th Terrorist Attacks
The third-quarter 2001 estimates of state personal income include effects of the terrorist attacks on the World Trade Center and on the Pentagon on September 11, 2001. Most of the effects of disasters on personal income are reflected in the usual source data. For certain components, however, BEA prepares adjustments to account for effects not captured in the source data.
The estimates of wages and salaries in state personal income were adjusted because the regular source data on employment, hours, and earnings are from the Bureau of Labor Statistics (BLS) monthly employment survey, which covers the mid-month pay period; thus for September, these data did not fully reflect the changes to labor markets following the September 11 attacks. BEA's adjustments to national wages reflected decreased hours due to work interruptions, decreased employment due to layoffs, and increased hours due to overtime work. The effect of the adjustments made by BEA was to lower the national estimates of private wages and salaries for September by $3.3 billion and to raise government wages and salaries by $0.9 billion. By state, the largest downward adjustments to private wages and salaries were to New York ($1.0 billion), New Jersey ($0.4 billion), Virginia ($0.2 billion), and Maryland ($0.2 billion). The largest upward adjustments to government wages and salaries were to the same four states New York ($0.4 billion), New Jersey ($0.1 billion), Virginia ($0.1 billion), and Maryland ($0.1 billion).
In April, BEA will revise these third-quarter state estimates to incorporate more comprehensive BLS tabulations of wages and salaries of employees. These tabulations will capture more fully the effects of the attacks, so the explicit state adjustments made here will be removed.
Definitions
Personal income is the income received by all persons from participation in production, from government and business transfer payments, and from government interest. Personal income is the sum of net earnings by place of residence, rental income of persons, personal dividend income, personal interest income, and transfer payments. Net earnings is earnings by place of work the sum of wage and salary disbursements (payrolls), other labor income, and proprietors' income less personal contributions for social insurance, plus an adjustment to convert earnings by place of work to a place-of-residence basis. Personal income is measured before the deduction of personal income taxes and other personal taxes and is reported in current dollars (no adjustment is made for price changes).
The estimate of personal income in the United States is derived as the sum of the state estimates; it differs from the estimate of personal income in the national income and product accounts (NIPA's) because of differences in coverage, in the methodologies used to prepare the estimates, and in the timing of the availability of source data.
BEA's major national, international, regional, and industry estimates; the Survey of Current Business; and BEA news releases are available without charge on BEA's Web site:
STAT-USA maintains an Internet site that contains BEA estimates, the Survey of Current Business, and BEA news releases. For information about STAT-USA, go to www.stat-usa.gov>, or call (202) 482-1986. Subscriptions for single-user unlimited access to STAT-USA's Internet information are $75.00 for 3 months or $175.00 for one year.
Summary BEA estimates are available on recorded messages at the time of public release at the following telephone numbers:
      (202)  606-5306   Gross domestic product
             606-5303   Personal income and outlays
             606-5362   U.S. international transactions
Most of BEA's estimates and analyses are published in the Survey of Current Business, BEA's monthly journal. Subscriptions and single copies of the printed Survey are for sale by the Superintendent of Documents, U.S. Government Printing Office. Internet: bookstore.gpo.gov>; phone: 202-512-1800; fax: 202-512-2250; mail: SSOP, Washington, DC 20402-0001.
                                         Table 1. -- Personal Income, by State and Region, 2000:II-2001:III
                                             [Millions of dollars, seasonally adjusted at annual rates]
----------------------------------------------------------------------------------------------------------------------------------------------------
                                                                                                                                         Percent
                                           2000                              2001               Percent change from preceding quarter/1/ change
                              -------------------------------  -------------------------------  ---------------------------------------  2000:III-
                                 II        III          IV          I/r/     II/r/     III/p/    2000:IV   2001:I  2001:II  2001:III     2001:III/2/

 ---------------------------------------------------------------------------------------------  ----------------------------------------------------
 United States .............. 8,264,219  8,374,722  8,512,567  8,632,966  8,705,018  8,761,374       1.6      1.4     0.8      0.6        4.6

   New England
     Connecticut ............   138,448    140,111    142,690    146,083    146,503    146,760       1.8      2.4      .3       .2        4.7
     Maine ..................    32,364     32,534     32,996     34,039     34,266     34,701       1.4      3.2      .7      1.3        6.7
     Massachusetts ..........   236,408    241,958    247,074    250,894    250,462    252,183       2.1      1.5     -.2       .7        4.2
     New Hampshire ..........    40,504     41,007     42,165     42,944     43,102     43,389       2.8      1.8      .4       .7        5.8
     Rhode Island ...........    30,360     30,802     31,227     31,881     31,878     32,146       1.4      2.1     0         .8        4.4
     Vermont ................    16,433     16,390     16,828     17,242     17,434     17,565       2.7      2.5     1.1       .8        7.2
   Mideast
     Delaware ...............    24,225     24,616     25,278     25,240     25,814     25,789       2.7      -.2     2.3      -.1        4.8
     District of Columbia ...    21,762     21,938     22,594     22,655     23,077     23,314       3.0       .3     1.9      1.0        6.3
     Maryland ...............   176,626    179,562    183,807    187,403    189,598    191,479       2.4      2.0     1.2      1.0        6.6
     New Jersey .............   311,145    314,788    323,766    323,003    326,402    327,139       2.9      -.2     1.1       .2        3.9
     New York ...............   650,883    658,647    675,787    688,745    683,299    686,047       2.6      1.9     -.8       .4        4.2
     Pennsylvania ...........   360,846    365,038    371,431    378,116    380,337    381,855       1.8      1.8      .6       .4        4.6
   Great Lakes
     Illinois ...............   393,233    399,127    405,556    411,517    411,726    412,980       1.6      1.5      .1       .3        3.5
     Indiana ................   163,277    165,178    165,374    168,247    169,182    170,160        .1      1.7      .6       .6        3.0
     Michigan ...............   288,883    290,572    293,068    294,691    298,708    299,395        .9       .6     1.4       .2        3.0
     Ohio ...................   316,416    318,662    321,892    324,581    329,798    331,981       1.0       .8     1.6       .7        4.2
     Wisconsin ..............   150,318    151,651    154,277    156,807    157,918    159,449       1.7      1.6      .7      1.0        5.1
   Plains
     Iowa ...................    77,340     78,047     78,423     79,567     80,242     81,375        .5      1.5      .8      1.4        4.3
     Kansas .................    73,560     75,204     74,915     76,473     76,775     77,553       -.4      2.1      .4      1.0        3.1
     Minnesota ..............   156,606    158,854    162,129    164,137    165,310    165,897       2.1      1.2      .7       .4        4.4
     Missouri ...............   151,938    153,613    155,555    157,789    158,917    159,466       1.3      1.4      .7       .3        3.8
     Nebraska ...............    47,339     47,903     47,931     48,183     48,693     49,322        .1       .5     1.1      1.3        3.0
     North Dakota ...........    16,075     16,069     15,971     16,575     16,550     16,750       -.6      3.8     -.1      1.2        4.2
     South Dakota ...........    19,727     19,771     19,943     19,935     20,280     20,442        .9      0       1.7       .8        3.4
   Southeast
     Alabama ................   104,586    104,671    106,399    108,054    109,488    110,137       1.7      1.6     1.3       .6        5.2
     Arkansas ...............    58,635     59,613     59,124     61,067     61,393     62,040       -.8      3.3      .5      1.1        4.1
     Florida ................   444,037    450,034    459,645    464,610    473,008    477,718       2.1      1.1     1.8      1.0        6.2
     Georgia ................   227,472    229,956    234,344    237,453    240,626    241,245       1.9      1.3     1.3       .3        4.9
     Kentucky ...............    96,771     98,117     99,556    101,257    102,038    102,868       1.5      1.7      .8       .8        4.8
     Louisiana ..............   103,199    103,535    104,035    106,375    107,447    108,190        .5      2.2     1.0       .7        4.5
     Mississippi ............    59,489     59,766     60,256     61,229     61,646     62,138        .8      1.6      .7       .8        4.0
     North Carolina .........   216,158    218,512    222,497    226,150    227,539    230,119       1.8      1.6      .6      1.1        5.3
     South Carolina .........    96,332     96,910     98,355    100,241    100,494    100,930       1.5      1.9      .3       .4        4.1
     Tennessee ..............   147,045    148,763    150,682    153,172    154,846    156,294       1.3      1.7     1.1       .9        5.1
     Virginia ...............   219,484    222,274    227,285    230,004    236,014    238,217       2.3      1.2     2.6       .9        7.2
     West Virginia ..........    39,343     39,456     40,190     40,782     41,338     41,505       1.9      1.5     1.4       .4        5.2
   Southwest
     Arizona ................   127,750    129,875    132,013    133,876    136,136    137,447       1.6      1.4     1.7      1.0        5.8
     New Mexico .............    39,993     40,197     40,837     41,597     42,309     42,840       1.6      1.9     1.7      1.3        6.6
     Oklahoma ...............    81,040     82,152     83,611     84,735     85,271     86,315       1.8      1.3      .6      1.2        5.1
     Texas ..................   577,766    584,898    594,320    610,544    610,998    616,997       1.6      2.7      .1      1.0        5.5
   Rocky Mountain
     Colorado ...............   139,522    142,828    145,344    146,053    147,489    148,321       1.8       .5     1.0       .6        3.8
     Idaho ..................    30,684     30,968     31,504     31,707     32,411     32,697       1.7       .6     2.2       .9        5.6
     Montana ................    20,312     20,599     20,802     21,067     21,472     21,692       1.0      1.3     1.9      1.0        5.3
     Utah ...................    52,306     52,674     53,693     54,531     55,608     55,962       1.9      1.6     2.0       .6        6.2
     Wyoming ................    13,472     13,587     13,980     14,013     14,303     14,482       2.9       .2     2.1      1.3        6.6
   Far West
     Alaska .................    18,499     18,792     18,942     19,260     19,714     19,918        .8      1.7     2.4      1.0        6.0
     California ............. 1,084,057  1,111,223  1,125,205  1,136,908  1,146,471  1,155,104       1.3      1.0      .8       .8        3.9
     Hawaii .................    33,708     33,854     34,473     34,838     34,990     35,239       1.8      1.1      .4       .7        4.1
     Nevada .................    59,631     60,006     60,886     62,280     63,487     63,569       1.5      2.3     1.9       .1        5.9
     Oregon .................    94,638     95,800     96,614     98,208     98,319     98,684        .8      1.6      .1       .4        3.0
     Washington .............   183,572    183,620    187,297    186,208    193,892    193,567       2.0      -.6     4.1      -.2        5.4
 BEA regions
   New England ..............   494,517    502,804    512,981    523,084    523,644    526,745       2.0      2.0      .1       .6        4.8
   Mideast .................. 1,545,487  1,564,588  1,602,664  1,625,161  1,628,527  1,635,621       2.4      1.4      .2       .4        4.5
   Great Lakes .............. 1,312,127  1,325,189  1,340,167  1,355,843  1,367,332  1,373,966       1.1      1.2      .8       .5        3.7
   Plains ...................   542,586    549,461    554,867    562,659    566,768    570,806       1.0      1.4      .7       .7        3.9
   Southeast ................ 1,812,551  1,831,608  1,862,368  1,890,394  1,915,878  1,931,401       1.7      1.5     1.3       .8        5.4
   Southwest ................   826,550    837,121    850,780    870,752    874,714    883,599       1.6      2.3      .5      1.0        5.6
   Rocky Mountain ...........   256,296    260,656    265,322    267,371    271,282    273,154       1.8       .8     1.5       .7        4.8
   Far West ................. 1,474,105  1,503,295  1,523,417  1,537,702  1,556,872  1,566,081       1.3       .9     1.2       .6        4.2
 ---------------------------------------------------------------------------------------------------------------------------------------------------
   r Revised.
   p Preliminary.
   1. Percent changes are expressed at quarterly rates.
   2. Percent changes are expressed at annual rates.
   Note: Estimates may not add to totals because of rounding.
   Source: U.S. Bureau of Economic Analysis
Table 2. -- Personal Income by Component, by State and Region, 2001:II-2001:III [Seasonally adjusted] ---------------------------------------------------------------------------------------------------------------------------------------------------- Percent change Contribution to percent change Dollar change (millions)/2/ in personal income (percentage points) ------------------------------------- ----------------------------- ----------------------------------- Divi- Divi- Divi- dends, Trans- Percent dends, Trans- dends, Trans- Personal Net inter- fer change in Net inter- fer Personal Net inter- fer income earn- est, pay- personal earn- est, pay- income earn- est, pay- ings/1/ and ments income ings/1/ and ments ings/1/ and ments rent rent rent ---------------------------------------------------------------------------------------------------------------------------------------------------- United States .............. 0.6 0.6 0.2 1.7 0.6 0.38 0.04 0.23 56,356 33,141 3,530 19,685 New England Connecticut ............ .2 0 0 1.7 .2 -.01 0 .19 257 -14 -1 273 Maine .................. 1.3 1.4 .1 1.8 1.3 .95 .02 .30 435 324 7 104 Massachusetts .......... .7 .6 .2 2.0 .7 .42 .03 .23 1,721 1,053 83 586 New Hampshire .......... .7 .7 -.2 1.9 .7 .50 -.03 .20 287 215 -13 85 Rhode Island ........... .8 .8 .1 1.7 .8 .54 .02 .28 268 174 6 89 Vermont ................ .8 .7 .2 1.8 .8 .46 .03 .26 131 81 6 45 Mideast Delaware ............... -.1 -.4 0 1.6 -.1 -.29 0 .19 -25 -75 0 50 District of Columbia ... 1.0 1.4 -.3 1.1 1.0 .93 -.05 .14 237 215 -12 33 Maryland ............... 1.0 1.1 .2 1.9 1.0 .76 .04 .19 1,881 1,448 81 352 New Jersey ............. .2 0 .1 1.7 .2 .02 .02 .18 737 69 75 592 New York ............... .4 .2 0 1.5 .4 .16 0 .24 2,748 1,105 27 1,614 Pennsylvania ........... .4 .2 .1 1.6 .4 .13 .01 .25 1,518 510 41 965 Great Lakes Illinois ............... .3 .1 .2 1.6 .3 .10 .03 .18 1,254 394 128 732 Indiana ................ .6 .5 .3 1.5 .6 .33 .05 .20 978 551 85 343 Michigan ............... .2 0 .1 1.3 .2 .03 .02 .18 687 93 62 532 Ohio ................... .7 .7 0 1.3 .7 .48 0 .19 2,183 1,573 -16 626 Wisconsin .............. 1.0 1.1 0 1.7 1.0 .76 0 .21 1,531 1,197 -2 336 Plains Iowa ................... 1.4 1.8 0 1.6 1.4 1.19 0 .22 1,133 955 -1 178 Kansas ................. 1.0 1.2 0 1.4 1.0 .82 .01 .18 778 631 7 138 Minnesota .............. .4 .2 .2 1.9 .4 .10 .04 .21 587 173 69 345 Missouri ............... .3 .2 0 1.7 .3 .10 -.01 .25 549 158 -10 399 Nebraska ............... 1.3 1.6 .1 1.9 1.3 1.03 .01 .25 629 503 6 121 North Dakota ........... 1.2 1.5 .1 1.3 1.2 .98 .02 .20 200 163 4 34 South Dakota ........... .8 .9 .2 1.6 .8 .55 .04 .22 162 112 8 44 Southeast Alabama ................ .6 .4 .1 1.7 .6 .29 .01 .29 649 321 10 317 Arkansas ............... 1.1 1.1 .1 1.8 1.1 .71 .01 .32 647 438 9 198 Florida ................ 1.0 1.1 .2 1.7 1.0 .68 .05 .26 4,710 3,218 246 1,246 Georgia ................ .3 0 .5 1.8 .3 -.03 .08 .20 619 -68 197 491 Kentucky ............... .8 .7 .1 2.0 .8 .45 .01 .35 830 464 10 356 Louisiana .............. .7 .6 .8 1.0 .7 .39 .14 .17 743 419 148 177 Mississippi ............ .8 .6 .5 1.8 .8 .36 .08 .36 492 222 48 223 North Carolina ......... 1.1 1.2 .1 2.3 1.1 .80 .01 .32 2,580 1,817 31 731 South Carolina ......... .4 .1 .2 2.1 .4 .06 .04 .33 436 65 37 334 Tennessee .............. .9 1.0 -.2 1.9 .9 .66 -.04 .31 1,448 1,024 -56 482 Virginia ............... .9 1.0 .1 2.0 .9 .73 .02 .18 2,203 1,721 46 436 West Virginia .......... .4 .3 -.3 1.3 .4 .16 -.05 .29 167 66 -19 120 Southwest Arizona ................ 1.0 1.0 .3 1.9 1.0 .66 .05 .25 1,311 892 73 346 New Mexico ............. 1.3 1.4 .1 2.1 1.3 .89 .02 .34 531 378 10 144 Oklahoma ............... 1.2 1.3 .2 1.8 1.2 .90 .04 .28 1,044 767 34 242 Texas .................. 1.0 .8 1.2 2.1 1.0 .58 .16 .23 5,999 3,565 1,006 1,430 Rocky Mountain Colorado ............... .6 .4 .2 2.3 .6 .33 .04 .19 832 486 60 286 Idaho .................. .9 .8 .2 2.4 .9 .52 .04 .32 286 170 13 103 Montana ................ 1.0 1.4 -.2 1.3 1.0 .84 -.03 .22 220 179 -7 48 Utah ................... .6 .6 .2 1.8 .6 .42 .03 .18 354 235 18 103 Wyoming ................ 1.3 1.5 .4 1.6 1.3 .96 .10 .20 179 138 14 28 Far West Alaska ................. 1.0 1.3 0 .9 1.0 .90 -.01 .15 204 177 -1 29 California ............. .8 .7 .5 1.7 .8 .48 .09 .19 8,633 5,464 976 2,193 Hawaii ................. .7 .8 .1 1.4 .7 .52 .02 .17 249 182 7 60 Nevada ................. .1 -.1 0 2.3 .1 -.10 -.01 .24 82 -64 -6 152 Oregon ................. .4 .1 -.1 2.3 .4 .08 -.03 .31 365 82 -25 308 Washington ............. -.2 -.6 0 2.1 -.2 -.42 .01 .25 -325 -822 11 484 BEA regions New England .............. .6 .5 .1 1.9 .6 .35 .02 .23 3,101 1,831 88 1,182 Mideast .................. .4 .3 .1 1.6 .4 .20 .01 .22 7,094 3,274 213 3,608 Great Lakes .............. .5 .4 .1 1.4 .5 .28 .02 .19 6,634 3,808 258 2,569 Plains ................... .7 .7 .1 1.7 .7 .48 .01 .22 4,038 2,694 83 1,261 Southeast ................ .8 .8 .2 1.8 .8 .51 .04 .27 15,523 9,707 706 5,111 Southwest ................ 1.0 .9 .8 2.0 1.0 .64 .13 .25 8,885 5,601 1,123 2,161 Rocky Mountain ........... .7 .6 .2 2.0 .7 .45 .04 .21 1,872 1,208 96 567 Far West ................. .6 .5 .3 1.8 .6 .32 .06 .21 9,209 5,019 963 3,227 ---------------------------------------------------------------------------------------------------------------------------------------------------- 1. Net earnings is earnings by place of work-the sum of wage and salary disbursements (payrolls), other labor income, and proprietors' income-less personal contributions for social insurance plus an adjustment to convert earnings by place of work to a place-of-residence basis. 2. Dollar changes are expressed at annual rates. Note: Estimates may not add to totals because of rounding. Source: U.S. Bureau of Economic Analysis
Table 3. -- Earnings by Major Industry, by State and Region, 2001:II-2001:III [Seasonally adjusted] --------------------------------------------------------------------------------------------------------------------------------------------------- Percent change ----------------------------------------------------------------------------------------------------------------------- Earnings by industry Earnings ------------------------------------------------------------------------------------------------------------ by place Non- of work Durable durable Transpor- Whole- Finance, Con- goods goods tation sale Retail insur- Govern- Farms Mining struction manu- manu- and public trade trade ance, Services ment facturing facturing utilities and real estate --------------------------------------------------------------------------------------------------------------------------------------------------- United States .............. 0.5 8.7 0.6 0.6 -1.2 -0.8 0.0 -0.2 0.1 0.4 1.0 1.6 New England Connecticut ............ -.1 12.3 -.3 -3.6 -1.0 -1.8 -.5 -2.1 -.9 .5 .8 1.7 Maine .................. 1.5 4.8 .2 -.3 1.9 1.9 .2 1.3 .7 .5 1.3 3.2 Massachusetts .......... .6 2.5 -2.1 .8 -1.2 0 -.1 0 .2 .8 1.1 1.1 New Hampshire .......... .7 4.0 9.8 1.7 .1 2.4 1.0 -.5 -.2 .5 1.2 .4 Rhode Island ........... .8 -1.3 1.9 4.5 -1.8 -.2 .7 -.6 .1 1.9 .9 1.8 Vermont ................ .6 11.8 -4.4 2.2 -2.0 -1.4 .7 -.2 .1 .2 .8 2.4 Mideast Delaware ............... -.6 10.9 /1/ 1.3 -8.4 -7.6 1.1 1.3 .1 .4 1.3 1.7 District of Columbia ... 1.3 --- /1/ 2.6 -1.3 -.9 1.5 -.4 -.2 1.2 1.1 1.8 Maryland ............... 1.0 6.8 4.4 1.3 -1.4 -.3 -.5 .2 -.3 .8 1.5 2.0 New Jersey ............. 0 -3.2 1.3 .3 -2.8 -3.3 -.8 -.8 -.7 .4 1.0 1.8 New York ............... .2 3.7 -1.8 0 -.1 -1.2 0 -1.0 -1.0 -.3 .8 1.5 Pennsylvania ........... .2 4.2 .6 .4 -3.2 -1.2 -.9 0 .2 .4 1.6 .5 Great Lakes Illinois ............... .1 31.1 1.2 -1.9 -2.5 .6 -.2 -1.7 0 .5 .8 1.1 Indiana ................ .5 29.0 -.6 -.4 -.6 -.6 0 .2 -.4 .2 1.0 2.2 Michigan ............... 0 13.4 -5.8 .6 -2.0 -2.0 0 -.6 -.1 1.0 1.1 1.9 Ohio ................... .7 1.8 .5 .4 .7 -1.3 -.4 -.3 .1 .8 1.3 1.7 Wisconsin .............. 1.1 13.8 1.1 1.9 1.7 -.5 .7 -.2 .3 1.0 1.5 1.4 Plains Iowa ................... 1.8 15.0 -1.5 2.4 1.2 .6 .3 1.2 .6 .8 2.2 1.4 Kansas ................. 1.3 39.9 .7 1.6 -.8 .7 1.1 -.1 -.3 1.2 1.4 1.9 Minnesota .............. .1 9.9 -3.5 1.6 -2.7 -1.7 -.9 -.6 -.2 .1 .8 1.7 Missouri ............... .1 18.3 -5.4 -.1 -1.6 .1 0 -.8 -.5 .2 .6 .2 Nebraska ............... 1.5 11.9 .5 .1 -1.1 5.4 1.2 .6 -.4 .2 2.0 1.6 North Dakota ........... 1.4 21.7 2.8 -.9 -5.3 -.8 1.1 -.4 -.7 .6 1.2 .5 South Dakota ........... .8 0 -3.5 4.3 -1.9 -1.0 1.2 1.7 -.8 1.8 1.4 1.0 Southeast Alabama ................ .4 10.0 1.0 -.5 -1.4 -1.0 -.5 -.7 -.6 .6 1.2 1.6 Arkansas ............... 1.1 9.7 -1.9 .8 0 .1 .5 .9 -.2 .9 1.4 1.6 Florida ................ 1.1 -9.2 /1/ 2.5 0 1.0 1.0 .9 .5 .5 1.7 1.3 Georgia ................ -.1 13.9 1.3 .7 -3.0 .7 -.6 -.9 -.1 -.3 0 .2 Kentucky ............... .6 20.0 .5 0 -4.4 -3.3 .8 .3 .4 .9 1.8 1.9 Louisiana .............. .6 1.6 1.2 1.8 -.3 -1.3 -.2 .3 .5 .4 .9 .9 Mississippi ............ .5 1.5 3.5 .8 .6 -.9 -1.0 .2 -.4 1.1 1.0 .8 North Carolina ......... 1.1 12.6 -.2 2.2 -2.7 -.3 -.1 1.8 .6 .6 1.6 2.7 South Carolina ......... 0 6.8 -.2 .4 -2.6 -4.2 .7 .2 .5 .8 .5 1.9 Tennessee .............. 1.0 4.8 -3.1 .4 1.2 1.6 -.3 .4 .1 .4 1.9 .7 Virginia ............... .9 -.4 -.1 2.0 -2.9 .2 0 -.2 -.6 .3 1.4 2.3 West Virginia .......... .2 28.1 2.0 -2.4 -3.8 -4.4 .3 -.2 0 .5 1.7 1.2 Southwest Arizona ................ .9 46.8 -1.9 -1.2 -.3 -1.0 0 .8 .5 .6 -.1 3.8 New Mexico ............. 1.3 17.0 -.4 .9 -1.7 3.4 1.7 -1.2 .3 .8 1.9 1.2 Oklahoma ............... 1.3 2.1 1.1 1.4 4.0 -.8 -.1 -.5 .4 1.8 2.2 1.2 Texas .................. .8 4.3 1.0 1.7 -2.1 -1.1 1.2 .1 1.3 .6 1.3 1.1 Rocky Mountain Colorado ............... .4 .6 .9 .2 -.3 -.4 -.2 -.7 .7 .5 .5 1.5 Idaho .................. .8 .1 -2.3 4.6 -.9 .5 2.0 -2.1 0 1.0 1.6 .1 Montana ................ 1.3 .6 2.5 .9 -1.6 6.5 1.0 .9 .4 .6 1.5 2.1 Utah ................... .5 4.2 -3.3 .6 -2.1 .3 1.2 -.1 -.3 1.5 .5 2.1 Wyoming ................ 1.5 .8 1.6 -2.7 4.5 6.5 .5 1.6 -.2 .2 .3 4.6 Far West Alaska ................. 1.3 8.3 .3 1.7 -3.0 11.4 .4 .4 .5 -.1 2.1 1.0 California ............. .6 7.2 .2 .4 -1.4 -.7 .1 0 -.1 .6 1.1 2.0 Hawaii ................. .7 3.9 .5 -.4 2.0 .1 0 -2.1 0 -.2 .4 2.3 Nevada ................. -.2 9.0 -1.8 .5 -6.9 -2.5 -7.1 .4 .8 0 .7 1.0 Oregon ................. .1 5.4 3.0 -2.7 -.6 -2.4 .1 -1.3 -.1 .7 .5 1.8 Washington ............. -.7 4.2 -.6 .7 1.6 1.4 -.5 -.5 -.2 .4 -4.0 2.0 BEA regions New England .............. .5 8.6 -.4 0 -.9 -.2 0 -.6 -.1 .7 1.0 1.5 Mideast .................. .3 3.8 .5 .4 -1.9 -1.9 -.4 -.6 -.5 0 1.1 1.5 Great Lakes .............. .4 18.5 -1.0 -.2 -.8 -.7 -.1 -.8 0 .7 1.1 1.6 Plains ................... .7 14.5 -1.4 1.1 -1.4 .1 .2 -.2 -.2 .4 1.1 1.2 Southeast ................ .7 6.8 .9 1.3 -1.6 -.5 .1 .3 .2 .4 1.3 1.5 Southwest ................ .9 11.0 .9 1.1 -1.2 -.9 1.0 .1 1.0 .7 1.2 1.5 Rocky Mountain ........... .6 .7 .6 .7 -.9 .5 .3 -.6 .4 .8 .6 1.7 Far West ................. .4 6.6 0 .3 -1.0 -.4 -.3 -.2 -.1 .5 .4 2.0 --------------------------------------------------------------------------------------------------------------------------------------------------- 1. Data are suppressed to avoid disclosure of confidential information. Source: U.S. Bureau of Economic Analysis
Table 4. -- Contribution to Percent Change in Earnings, by State and Region, 2001:II-2001:III ------------------------------------------------------------------------------------------------------------------------------------------------------ Percentage points ----------------------------------------------------------------------------------------------------------------------- Earnings by industry ------------------------------------------------------------------------------------------------------------ Earnings Non- by place Durable durable Transpor- Whole Finance, of work Con- goods goods tation sale Retail insur- Ser- Govern- Farms Mining struction manu- manu- and public trade trade ance, vices ment facturing facturing utilities and real estate ------------------------------------------------------------------------------------------------------------------------------------------------------ United States .............. 0.5 0.07 0.01 0.04 -0.12 -0.04 0.00 -0.02 0.00 0.04 0.30 0.24 New England Connecticut ............ -.1 .03 0 -.19 -.13 -.10 -.03 -.12 -.07 .08 .25 .21 Maine .................. 1.5 .03 0 -.02 .15 .14 .01 .07 .08 .04 .37 .57 Massachusetts .......... .6 0 0 .04 -.12 0 0 0 .02 .10 .41 .12 New Hampshire .......... .7 .01 .01 .12 .02 .12 .04 -.04 -.03 .04 .35 .04 Rhode Island ........... .8 0 0 .25 -.18 -.01 .04 -.03 .01 .16 .28 .32 Vermont ................ .6 .20 -.01 .15 -.31 -.06 .03 -.01 .01 .01 .23 .38 Mideast Delaware ............... -.6 .07 /1/ .08 -.45 -1.06 .05 .06 .01 .07 .35 .23 District of Columbia ... 1.3 --- /1/ .03 0 -.02 .05 0 0 .09 .47 .71 Maryland ............... 1.0 .02 .01 .09 -.07 -.01 -.03 .01 -.03 .07 .49 .44 New Jersey ............. 0 0 0 .01 -.14 -.30 -.07 -.07 -.06 .04 .31 .23 New York ............... .2 .01 0 0 0 -.06 0 -.05 -.06 -.07 .27 .19 Pennsylvania ........... .2 .02 0 .02 -.33 -.10 -.06 0 .02 .03 .51 .07 Great Lakes Illinois ............... .1 .10 0 -.11 -.25 .04 -.02 -.12 0 .06 .24 .14 Indiana ................ .5 .14 0 -.02 -.12 -.05 0 .01 -.03 .01 .24 .28 Michigan ............... 0 .03 -.02 .04 -.45 -.13 0 -.04 -.01 .06 .28 .24 Ohio ................... .7 .01 0 .02 .11 -.09 -.02 -.02 .01 .06 .36 .25 Wisconsin .............. 1.1 .09 0 .12 .27 -.05 .04 -.01 .02 .07 .37 .20 Plains Iowa ................... 1.8 .47 0 .15 .15 .05 .02 .08 .05 .07 .51 .23 Kansas ................. 1.3 .39 .01 .10 -.09 .04 .10 -.01 -.03 .08 .35 .33 Minnesota .............. .1 .10 -.01 .10 -.30 -.13 -.06 -.04 -.02 .01 .22 .23 Missouri ............... .1 .11 -.02 -.01 -.15 .01 0 -.06 -.04 .02 .16 .03 Nebraska ............... 1.5 .26 0 .01 -.07 .37 .13 .04 -.03 .02 .54 .26 North Dakota ........... 1.4 1.25 .06 -.05 -.28 -.02 .09 -.03 -.06 .04 .29 .10 South Dakota ........... .8 0 -.01 .27 -.17 -.04 .07 .11 -.08 .15 .34 .18 Southeast Alabama ................ .4 .14 .01 -.03 -.15 -.08 -.03 -.04 -.06 .03 .31 .31 Arkansas ............... 1.1 .30 -.01 .05 0 .01 .04 .05 -.03 .04 .32 .28 Florida ................ 1.1 -.10 /1/ .16 0 .03 .06 .06 .06 .05 .60 .21 Georgia ................ -.1 .13 0 .04 -.20 .05 -.06 -.07 -.01 -.02 .01 .03 Kentucky ............... .6 .49 .01 0 -.58 -.22 .06 .02 .04 .05 .41 .33 Louisiana .............. .6 .01 .06 .12 -.02 -.09 -.02 .02 .04 .02 .24 .17 Mississippi ............ .5 .02 .03 .05 .08 -.06 -.06 .01 -.04 .05 .25 .17 North Carolina ......... 1.1 .25 0 .15 -.29 -.03 0 .10 .06 .04 .39 .46 South Carolina ......... 0 .05 0 .03 -.25 -.45 .05 .01 .05 .05 .11 .38 Tennessee .............. 1.0 .01 -.01 .03 .13 .12 -.02 .02 .01 .03 .54 .09 Virginia ............... .9 0 0 .12 -.15 .01 0 -.01 -.04 .03 .47 .51 West Virginia .......... .2 .03 .12 -.15 -.30 -.28 .02 -.01 0 .02 .46 .25 Southwest Arizona ................ .9 .34 -.01 -.10 -.03 -.02 0 .05 .05 .07 -.04 .61 New Mexico ............. 1.3 .32 -.01 .06 -.09 .06 .11 -.05 .03 .04 .51 .32 Oklahoma ............... 1.3 .02 .06 .08 .35 -.05 -.01 -.02 .03 .10 .54 .24 Texas .................. .8 .03 .05 .11 -.17 -.05 .11 .01 .11 .05 .35 .16 Rocky Mountain Colorado ............... .4 0 .01 .02 -.02 -.01 -.02 -.04 .07 .05 .14 .21 Idaho .................. .8 .01 -.02 .40 -.11 .02 .12 -.12 0 .05 .38 .02 Montana ................ 1.3 .01 .06 .07 -.07 .16 .08 .04 .04 .04 .43 .46 Utah ................... .5 .02 -.04 .05 -.19 .01 .09 -.01 -.03 .12 .16 .37 Wyoming ................ 1.5 .01 .24 -.22 .10 .20 .04 .06 -.02 .01 .06 1.04 Far West Alaska ................. 1.3 .01 .02 .13 -.03 .30 .04 .01 .04 0 .47 .32 California ............. .6 .07 0 .03 -.15 -.03 .01 0 -.01 .05 .36 .30 Hawaii ................. .7 .03 0 -.03 .02 0 0 -.08 0 -.01 .13 .66 Nevada ................. -.2 .02 -.03 .05 -.24 -.04 -.48 .02 .08 0 .28 .14 Oregon ................. .1 .06 0 -.19 -.08 -.08 .01 -.09 -.01 .05 .12 .29 Washington ............. -.7 .05 0 .04 .17 .05 -.03 -.03 -.02 .03 -1.28 .35 BEA regions New England .............. .5 .02 0 0 -.11 -.01 0 -.03 -.01 .09 .34 .19 Mideast .................. .3 .01 0 .02 -.12 -.12 -.03 -.03 -.04 0 .36 .22 Great Lakes .............. .4 .07 0 -.01 -.13 -.05 0 -.05 0 .05 .29 .21 Plains ................... .7 .23 -.01 .07 -.14 0 .01 -.01 -.02 .04 .30 .18 Southeast ................ .7 .08 .01 .08 -.13 -.03 .01 .02 .02 .03 .38 .26 Southwest ................ .9 .09 .04 .07 -.10 -.04 .08 .01 .09 .06 .32 .24 Rocky Mountain ........... .6 .01 .01 .06 -.07 .02 .03 -.03 .03 .06 .19 .28 Far West ................. .4 .07 0 .02 -.10 -.02 -.02 -.01 -.01 .04 .14 .31 ------------------------------------------------------------------------------------------------------------------------------------------------------ 1. Data are suppressed to avoid disclosure of confidential information. Source: U.S. Bureau of Economic Analysis