 |
Available for this release:  Full Release: PDF (104 kb), Full Release: PDF (104 kb),  Tables: XLS (75 kb), Tables: XLS (75 kb),  Highlights (44 kb) Highlights (44 kb)
| Technical: |
Erich H. Strassner: |
(202) 606-5307
|
|
BEA 05-16 |
| Media: |
Ralph Stewart: |
606-9690 |
|
|
Expansion in 2004 Led by Broad-Based Growth in Services-Producing Sector
|
Advance Estimates of Gross Domestic Product (GDP) by Industry for 2004
|
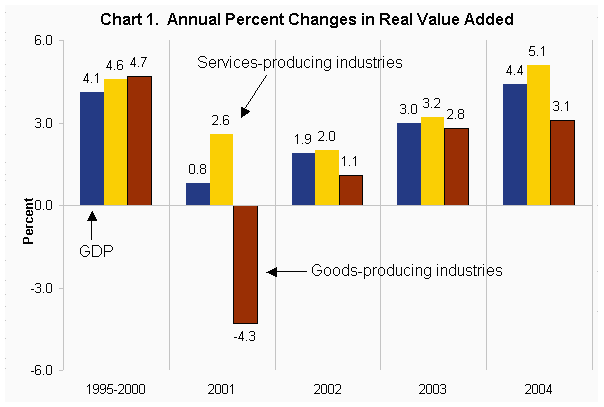
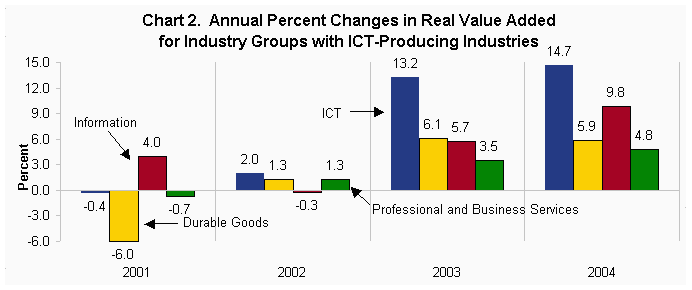
Newly-available data on the industry distribution of growth in GDP show the services-producing sector led the economic expansion in 2004, as 7 out of 10 services-producing industry groups contributed to faster growth in real GDP. According to the U.S. Bureau of Economic Analysis (BEA), advance-industry estimates for 2004 also show a strong contribution from continuing double-digit growth for Information-communications-technology-(ICT)-producing industries.
Manufacturing industries, within the goods-producing sector, continued their recovery but were outpaced by the services-producing sector in 2004.

Source: U.S. Bureau of Economic Analysis
ICT-producing industries, which span both the goods- and services-producing sectors, increased 14.7 percent in 2004. Accordingly, the Information industry group, which includes software publishing and information and data processing, increased 9.8 percent. Durable-goods manufacturing, which includes computer and electronic products, grew 5.9 percent to lead the goods-producing sector.

Source: U.S. Bureau of Economic Analysis
Other highlights of the advance-industry estimates for 2004 show the following results:
-
Finance, insurance, real estate, rental, and leasing (FIRE) contributed more than any other industry group to real GDP growth – about 25 percent in 2004. FIRE industries comprised a larger share of current-dollar GDP (20.7 percent) than goods-producing industries (19.6 percent) in 2004.
-
ICT-producing industries contributed 13 percent to real GDP growth in 2004, yet comprised just 4.2 percent of current-dollar GDP.
-
Wholesale trade recovered in 2004 – increasing 3.3 percent after declining 1.9 percent in 2003.
-
Price growth for goods-producing industries increased sharply at 3.9 percent in 2004, reflecting, in part, rising prices for petroleum, wood, and metal products that were only partially offset by falling prices for ICT products. Prices for durable-goods manufacturing increased 2.1 percent in 2004 – the first increase since 1994.
Additional Information:
- This is the first April release of advance GDP-by-industry estimates on the 1997 North American Industry Classification System. The advance estimates for 2004 – released just four months after the reference year – are prepared for broad industry groups and are based on a methodology developed for summary source data.
| Note: These estimates rely heavily on industry data underlying the “final” 2004 fourth quarter GDP release from the national income and product accounts (NIPAs). Definitional and conceptual differences affect the comparability of some NIPA and GDP-by-industry measures. For example, in the NIPAs, the value added by goods-distribution (e.g., transport and trade) industries is included in the market value of goods. In the GDP-by-industry accounts, however, the value added by goods-distribution industries is included in the services-producing sector. For more information, see “Gross Domestic Product by Industry for 1987-2000” in the November 2004 issue of the Survey of Current Business. |
BEA’s national, international, regional, and industry estimates; the Survey of Current Business; and BEA news releases are available without charge on BEA’s Web site at www.bea.gov. By visiting the site, you can also subscribe to receive free e-mail summaries of BEA releases and announcements.
****
Table 1. Percent Changes in Real Value Added by Industry Group
| |
2001 |
2002 |
2003 |
2004 |
Average annual rate of change 1995-2000 |
| Gross domestic product |
0.8 |
1.9 |
3.0 |
4.4 |
4.1 |
| |
|
|
|
|
|
| Private industries |
0.9 |
1.8 |
3.1 |
4.6 |
4.6 |
| Agriculture, forestry, fishing, and hunting |
-6.3 |
6.8 |
5.5 |
-6.4 |
6.5 |
| Mining |
-5.3 |
-2.2 |
-7.0 |
2.2 |
-1.1 |
| Utilities |
-4.9 |
6.0 |
5.9 |
5.4 |
1.3 |
| Construction |
0.2 |
-2.6 |
-0.3 |
2.2 |
3.0 |
| Manufacturing |
-5.6 |
2.3 |
4.5 |
4.3 |
5.4 |
| Durable goods |
-6.0 |
1.3 |
6.1 |
5.9 |
8.9 |
| Nondurable goods |
-5.0 |
3.7 |
2.4 |
2.2 |
0.4 |
| Wholesale trade |
7.0 |
1.6 |
-1.9 |
3.3 |
7.2 |
| Retail trade |
7.0 |
5.3 |
5.6 |
5.2 |
6.5 |
| Transportation and warehousing |
-2.6 |
1.9 |
5.0 |
3.3 |
4.4 |
| Information |
4.0 |
-0.3 |
5.7 |
9.8 |
8.0 |
| Finance, insurance, real estate, rental, and leasing |
3.9 |
1.4 |
3.2 |
5.6 |
4.4 |
| Professional and business services |
-0.7 |
1.3 |
3.5 |
4.8 |
5.3 |
| Educational services, health care, and social assistance |
3.2 |
3.8 |
2.8 |
2.7 |
1.4 |
| Arts, entertainment, recreation, accommodation, and food services |
-0.7 |
1.8 |
1.9 |
4.5 |
3.7 |
| Other services, except government |
-1.7 |
-0.8 |
0.5 |
7.1 |
0.1 |
| Government |
0.8 |
1.5 |
1.4 |
1.2 |
1.2 |
| |
|
|
|
|
|
| Addenda: |
|
|
|
|
|
| Private goods-producing industries1 |
-4.3 |
1.1 |
2.8 |
3.1 |
4.7 |
| Private services-producing industries2 |
2.6 |
2.0 |
3.2 |
5.1 |
4.6 |
| Information-communications-technology-producing industries3 |
-0.4 |
2.0 |
13.2 |
14.7 |
22.1 |
| 1. Consists of agriculture, forestry, fishing, and hunting; mining; construction; and manufacturing. |
| 2. Consists of utilities; wholesale trade; retail trade; transportation and warehousing; information; finance, insurance, real estate, rental, and leasing; professional and business services; educational services, health care, and social assistance; arts, entertainment, recreation, accommodation, and food services; and other services, except government. |
| 3. Consists of computer and electronic products within durable-goods manufacturing; publishing industries (includes software) and information and data processing services within information; and computer systems design and related services within professional and business services. |
| Source: U.S. Bureau of Economic Analysis |
Table 2. Contributions to Percent Change in Real GDP by Industry Group
| |
2001 |
2002 |
2003 |
2004 |
Average annual rate of change 1995-2000 |
| Gross domestic product |
0.8 |
1.9 |
3.0 |
4.4 |
4.1 |
| |
|
|
|
|
|
| Private industries |
0.80 |
1.60 |
2.68 |
4.02 |
4.04 |
| Agriculture, forestry, fishing, and hunting |
-0.06 |
0.06 |
0.05 |
-0.07 |
0.08 |
| Mining |
-0.07 |
-0.02 |
-0.08 |
0.03 |
-0.01 |
| Utilities |
-0.10 |
0.12 |
0.12 |
0.11 |
0.02 |
| Construction |
0.01 |
-0.12 |
-0.01 |
0.10 |
0.12 |
| Manufacturing |
-0.80 |
0.31 |
0.58 |
0.54 |
0.83 |
| Durable goods |
-0.51 |
0.10 |
0.45 |
0.42 |
0.80 |
| Nondurable goods |
-0.29 |
0.21 |
0.13 |
0.12 |
0.03 |
| Wholesale trade |
0.41 |
0.09 |
-0.12 |
0.19 |
0.44 |
| Retail trade |
0.46 |
0.36 |
0.39 |
0.36 |
0.44 |
| Transportation and warehousing |
-0.08 |
0.06 |
0.15 |
0.10 |
0.14 |
| Information |
0.19 |
-0.01 |
0.25 |
0.44 |
0.35 |
| Finance, insurance, real estate, rental, and leasing |
0.76 |
0.28 |
0.66 |
1.14 |
0.84 |
| Professional and business services |
-0.08 |
0.15 |
0.39 |
0.55 |
0.57 |
| Educational services, health care, and social assistance |
0.22 |
0.28 |
0.21 |
0.21 |
0.09 |
| Arts, entertainment, recreation, accommodation, and food services |
-0.03 |
0.07 |
0.07 |
0.16 |
0.13 |
| Other services, except government |
-0.04 |
-0.02 |
0.01 |
0.17 |
0.00 |
| Government |
0.10 |
0.19 |
0.18 |
0.15 |
0.15 |
| |
|
|
|
|
|
| Addenda: |
|
|
|
|
|
| Private goods-producing industries1 |
-0.92 |
0.23 |
0.54 |
0.60 |
1.02 |
| Private services-producing industries2 |
1.72 |
1.38 |
2.14 |
3.42 |
3.03 |
| Information-communications-technology-producing industries3 |
-0.01 |
0.09 |
0.51 |
0.58 |
0.85 |
| 1. Consists of agriculture, forestry, fishing, and hunting; mining; construction; and manufacturing. |
| 2. Consists of utilities; wholesale trade; retail trade; transportation and warehousing; information; finance, insurance, real estate, rental, and leasing; professional and business services; educational services, health care, and social assistance; arts, entertainment, recreation, accommodation, and food services; and other services, except government. |
| 3. Consists of computer and electronic products within durable-goods manufacturing; publishing industries (includes software) and information and data processing services within information; and computer systems design and related services within professional and business services. |
| Note. Percentage-point contributions do not sum to the percent change in gross domestic product because the contribution of "not allocated by industry" is excluded. |
| Source: U.S. Bureau of Economic Analysis |
|
|