
News Release
Gross State Product (GSP) by Industry, 2001-2003 and Accelerated Total GSP for 2004
Available for this release: Full Release (PDF -) | Tables (XLS - ), Highlights (PDF - )
Sign up for e-mail subscriptions.
| Media: | |||
| Ralph Stewart, BEA | (202)606–2649 | BEA 08—24 | |
| Thomas Dail, BEA | (202) 606-9209 |
ECONOMIES GROW IN ALL STATES IN 2004
Prototype Gross State Product (GSP) Estimates
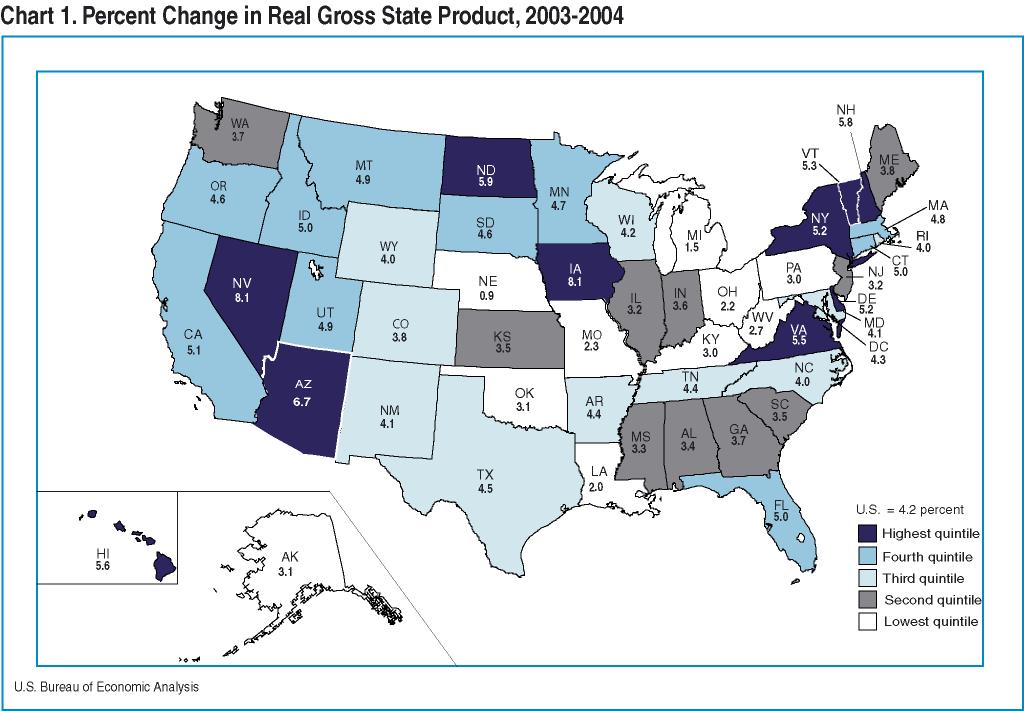
In 2004, strong U.S. real economic growth was widespread; real GSP grew in all 50 states and the District of Columbia, according to estimates released by the U.S. Bureau of Economic Analysis.1 GSP is the most comprehensive measure of overall economic activity in each state.
Highlights for 2004
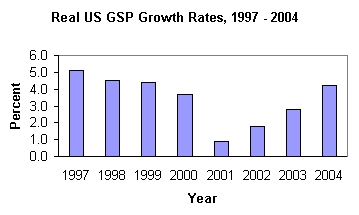
- Growth in real U.S. GSP accelerated from 2.8 percent in 2003 to 4.2 percent in 2004; all but seven states shared in that acceleration.
- The financial services and information-communications-technology sectors were the largest contributors to growth, and most of the fastest-growing states have large concentrations in one or both of these sectors.
Industry Detail for 2003
- Real GSP grew in all states except Alaska. Growth in services-providing industries was strong in all states.
- The financial services sector was the largest contributor to growth in 19 states; durable goods manufacturing was the largest contributor to growth in 12 states.
Revisions to the Estimates
- BEA's improved measures of banking output, fully incorporated into this set of GSP estimates, resulted in stronger growth in that industry for 44 states.
- Overall, the revisions had a limited impact on relative growth rates across states. The earlier prototype estimates for 2003 indicated successfully whether a state's growth was high, medium, or low (relative to national growth) for 78 percent of the states.
Tables 1-4 show these results in more detail; complete detail is available on BEA's web site at www.bea.gov.
BEA's national, international, regional, and industry estimates; the Survey of Current Business; and BEA news releases are available without charge on BEA's Web site at www.bea.gov. By visiting the site, you can also subscribe to receive free e-mail summaries of BEA releases and announcements.
Prototype accelerated estimates
The prototype 2004 GSP estimates are being released six months after the reference year, an acceleration of 12 months from past release schedules. Both current-dollar and real (chained) total GSP estimates for 2004 are provided in the release. The 2004 estimates are based on BEA earnings by industry estimates released March 28, 2005 and on accelerated GDP by industry estimates released April 20, 2005. More information on the methodology used to produce the prototype estimates, on the regular (revised) GSP estimates for 1997–2003, and on revisions to the GSP estimates will appear in an article in the July 2005 issue of the Survey of Current Business, BEA's monthly journal.
This release marks the second step toward regularly providing more timely estimates of GSP by industry. The first step was the December 2004 release of prototype current-dollar total GSP estimates for 2003. In the fall of 2005, as part of its strategic plan goal of significantly accelerating the release of its estimates, BEA plans to release both current-dollar and real NAICS sector-level GSP estimates for 2004— 10 months after the reference year and an acceleration of 8 months from past release schedules.
BEA is interested in your comments
Given the experimental nature of the accelerated estimates, BEA is interested in your views on the proposed methodology for the estimates, the appropriate level of industry detail, and the tradeoff between accuracy and timeliness. We encourage your feedback on the value of this initiative in BEA's Strategic Plan. Please e-mail your comments to BEA's Associate Director for Regional Economics, John W. Ruser, at gspread@bea.gov
Explanatory Notes
Definitions
GSP is the state counterpart of the Nation's gross domestic product (GDP), the Bureau's featured and most comprehensive measure of U.S. economic activity. GSP for a state is derived as the sum of the GSP originating in all the industries in the state.
Real GSP is an inflation-adjusted measure of each state's gross product that is based on national prices for the goods and services produced within that state. The estimates of real GSP and of quantity indexes with a base year of 2000 are derived by applying national implicit price deflators to the current-dollar GSP estimates for the 63 SIC industries for years 1977–1997, and for the 81 NAICS industries for years 1997 forward. Then, the chain-type index formula that is used in the national accounts is used to calculate the estimates of total real GSP and of real GSP at more aggregated industry levels.
The relation of GSP to Gross Domestic Product (GDP)
An industry's GSP, or its value added, is equal to its gross output (sales or receipts and other operating income, commodity taxes, and inventory change) minus its intermediate inputs (consumption of goods and services purchased from other U.S. industries or imported). Thus, the GSP accounts provide data by industry and state that are consistent with gross domestic product (GDP) in the national income and product accounts, and with the GDP by industry accounts.
However, for the NAICS-based GSP estimates for years 1997 forward, total GSP for the Nation differs from GDP in the national income and product accounts for two reasons. First, GSP excludes, and GDP and GDP by industry include, compensation of Federal civilian and military personnel stationed abroad and government consumption of fixed capital for military structures located abroad and for military equipment except domestically located office equipment. Second, GSP and GDP often have different revision schedules.
For the SIC-based GSP estimates for years 1977–1997, there is a third reason why U.S. GSP differs from GDP for the Nation. Like the national estimates of GDP by industry, GSP is measured as the sum of the distributions by industry of the components of gross domestic income, which differs from GDP by the statistical discrepancy. For 1997 forward, the statistical discrepancy is distributed among all private industries. This is not done for the SIC-based estimates.
Tables 1-4. Tables 1-4 are displayed below as unformatted text; the tables are also available in the PDF version of this news release and in XLS format.
Table 1. Real Gross State Product, 2000 - 2004
Millions of chained (2000) dollars Percent change Rank
2000 2001 2002 2003 2004* 2001 2002 2003 2004* 2004*
United States ...... 9,749,104 9,836,571 10,009,433 10,289,220 10,720,296 0.9 1.8 2.8 4.2 ......
New England ............ 568,212 573,703 573,700 588,536 617,107 1.0 0.0 2.6 4.9 ......
Connecticut .......... 160,685 161,595 160,115 164,137 172,355 0.6 -0.9 2.5 5.0 14
Maine ................ 35,662 36,138 37,110 38,097 39,536 1.3 2.7 2.7 3.8 31
Massachusetts ........ 276,786 279,434 278,213 284,286 298,020 1.0 -0.4 2.2 4.8 17
New Hampshire ........ 43,584 43,691 44,475 45,874 48,550 0.2 1.8 3.1 5.8 5
Rhode Island ......... 33,835 34,493 35,025 36,547 38,017 1.9 1.5 4.3 4.0 27
Vermont .............. 17,661 18,350 18,748 19,562 20,608 3.9 2.2 4.3 5.3 8
Mideast ................ 1,785,625 1,826,540 1,844,564 1,897,722 1,977,337 2.3 1.0 2.9 4.2 ......
Delaware ............. 42,359 43,802 44,545 46,952 49,413 3.4 1.7 5.4 5.2 10
District of Columbia . 58,425 61,087 62,582 64,137 66,871 4.6 2.4 2.5 4.3 ......
Maryland ............. 179,978 187,245 192,482 198,334 206,375 4.0 2.8 3.0 4.1 26
New Jersey ........... 343,959 354,390 363,045 371,806 383,725 3.0 2.4 2.4 3.2 40
New York ............. 769,403 783,183 777,099 801,038 843,084 1.8 -0.8 3.1 5.2 9
Pennsylvania ......... 391,501 396,814 404,630 415,281 427,825 1.4 2.0 2.6 3.0 43
Great Lakes ............ 1,543,596 1,528,043 1,545,045 1,574,421 1,617,825 -1.0 1.1 1.9 2.8 ......
Illinois ............. 464,257 465,299 465,826 470,101 485,231 0.2 0.1 0.9 3.2 39
Indiana .............. 194,683 190,876 194,993 201,263 208,434 -2.0 2.2 3.2 3.6 34
Michigan ............. 337,185 328,228 333,714 340,972 345,980 -2.7 1.7 2.2 1.5 49
Ohio ................. 371,228 365,791 369,354 375,740 384,049 -1.5 1.0 1.7 2.2 47
Wisconsin ............ 176,244 177,842 181,153 186,350 194,093 0.9 1.9 2.9 4.2 24
Plains ................. 633,151 636,973 650,624 668,730 695,886 0.6 2.1 2.8 4.1 ......
Iowa ................. 90,815 90,306 93,227 95,569 103,297 -0.6 3.2 2.5 8.1 1
Kansas ............... 83,427 84,696 85,765 86,814 89,896 1.5 1.3 1.2 3.5 35
Minnesota ............ 185,431 186,611 191,718 198,526 207,793 0.6 2.7 3.6 4.7 18
Missouri ............. 176,443 177,460 178,589 181,638 185,834 0.6 0.6 1.7 2.3 46
Nebraska ............. 55,727 56,158 57,599 60,672 61,216 0.8 2.6 5.3 0.9 50
North Dakota ......... 18,076 18,198 19,037 19,909 21,088 0.7 4.6 4.6 5.9 4
South Dakota ......... 23,230 23,544 24,691 25,609 26,774 1.4 4.9 3.7 4.6 20
Southeast .............. 2,116,572 2,151,297 2,194,566 2,265,174 2,358,882 1.6 2.0 3.2 4.1 ......
Alabama .............. 114,204 115,235 118,205 122,675 126,875 0.9 2.6 3.8 3.4 37
Arkansas ............. 66,176 66,656 68,060 69,734 72,812 0.7 2.1 2.5 4.4 22
Florida .............. 470,120 484,433 497,740 517,855 543,845 3.0 2.7 4.0 5.0 13
Georgia .............. 291,014 292,880 294,780 302,966 314,325 0.6 0.6 2.8 3.7 32
Kentucky ............. 112,737 113,530 116,269 120,508 124,079 0.7 2.4 3.6 3.0 44
Louisiana ............ 134,755 132,355 130,596 130,733 133,289 -1.8 -1.3 0.1 2.0 48
Mississippi .......... 64,133 63,736 65,222 66,646 68,857 -0.6 2.3 2.2 3.3 38
North Carolina ....... 274,306 279,893 286,943 295,897 307,601 2.0 2.5 3.1 4.0 29
South Carolina ....... 112,831 114,539 116,437 119,973 124,137 1.5 1.7 3.0 3.5 36
Tennessee ............ 174,349 175,936 183,168 191,186 199,547 0.9 4.1 4.4 4.4 23
Virginia ............. 260,257 270,072 274,458 283,922 299,402 3.8 1.6 3.4 5.5 7
West Virginia ........ 41,690 42,065 42,703 43,158 44,310 0.9 1.5 1.1 2.7 45
Southwest .............. 1,020,741 1,037,995 1,067,700 1,092,806 1,143,925 1.7 2.9 2.4 4.7 ......
Arizona .............. 157,639 162,407 167,980 175,536 187,271 3.0 3.4 4.5 6.7 3
New Mexico ........... 50,419 50,465 52,506 54,183 56,415 0.1 4.0 3.2 4.1 25
Oklahoma ............. 89,851 90,267 91,793 93,750 96,688 0.5 1.7 2.1 3.1 41
Texas ................ 722,832 734,864 755,448 769,410 803,734 1.7 2.8 1.8 4.5 21
Rocky Mountain ......... 313,252 319,294 324,354 332,227 346,477 1.9 1.6 2.4 4.3 ......
Colorado ............. 171,363 174,187 174,682 178,327 185,169 1.6 0.3 2.1 3.8 30
Idaho ................ 35,206 36,182 37,413 38,849 40,802 2.8 3.4 3.8 5.0 12
Montana .............. 21,367 21,838 22,621 23,493 24,654 2.2 3.6 3.9 4.9 15
Utah ................. 67,889 68,666 70,086 71,605 75,098 1.1 2.1 2.2 4.9 16
Wyoming .............. 17,427 18,417 19,533 19,940 20,736 5.7 6.1 2.1 4.0 28
Far West ............... 1,767,955 1,762,658 1,808,954 1,869,683 1,963,101 -0.3 2.6 3.4 5.0 ......
Alaska ............... 27,590 26,432 28,703 28,103 28,983 -4.2 8.6 -2.1 3.1 42
California ........... 1,291,113 1,288,775 1,324,277 1,369,235 1,438,737 -0.2 2.8 3.4 5.1 11
Hawaii ............... 40,176 40,532 41,398 42,964 45,370 0.9 2.1 3.8 5.6 6
Nevada ............... 74,797 75,892 78,167 83,603 90,350 1.5 3.0 7.0 8.1 2
Oregon ............... 112,964 110,925 112,943 116,113 121,411 -1.8 1.8 2.8 4.6 19
Washington ........... 221,314 220,096 223,456 229,680 238,286 -0.6 1.5 2.8 3.7 33
* Prototype estimates
Table 2. Gross State Product in Current Dollars, 2001 - 2004
Millions of dollars Percent of U.S. total
2001 2002 2003 2004* 2001 2002 2003 2004*
United States ..... 10,058,156 10,412,244 10,923,849 11,649,827 100.0 100.0 100.0 100.0
New England ........... 584,487 596,017 620,136 664,181 5.8 5.7 5.7 5.7
Connecticut ......... 165,434 167,235 174,085 187,086 1.6 1.6 1.6 1.6
Maine ............ 37,094 39,027 40,829 43,279 0.4 0.4 0.4 0.4
Massachusetts ....... 283,422 287,191 297,113 317,684 2.8 2.8 2.7 2.7
New Hampshire ....... 44,394 46,106 48,202 52,097 0.4 0.4 0.4 0.4
Rhode Island ........ 35,489 37,040 39,363 41,921 0.4 0.4 0.4 0.4
Vermont ............. 18,656 19,419 20,544 22,114 0.2 0.2 0.2 0.2
Mideast ............... 1,868,057 1,922,516 2,010,011 2,140,662 18.6 18.5 18.4 18.4
Delaware ............ 45,049 46,991 50,486 54,500 0.4 0.5 0.5 0.5
District of Columbia 63,223 67,176 70,668 75,264 0.6 0.6 0.6 0.6
Maryland ............ 192,425 202,840 213,073 226,513 1.9 1.9 2.0 1.9
New Jersey .......... 362,336 377,824 394,040 415,891 3.6 3.6 3.6 3.6
New York ............ 797,145 802,866 838,035 899,660 7.9 7.7 7.7 7.7
Pennsylvania ........ 407,880 424,820 443,709 468,833 4.1 4.1 4.1 4.0
Great Lakes ........... 1,565,557 1,611,658 1,669,527 1,758,915 15.6 15.5 15.3 15.1
Illinois ............ 476,851 486,182 499,731 528,904 4.7 4.7 4.6 4.5
Indiana ............. 195,769 203,296 213,342 227,271 1.9 2.0 2.0 2.0
Michigan ............ 335,793 347,014 359,440 372,756 3.3 3.3 3.3 3.2
Ohio ................ 374,771 385,657 398,918 418,258 3.7 3.7 3.7 3.6
Wisconsin ........... 182,373 189,508 198,096 211,727 1.8 1.8 1.8 1.8
Plains ................ 653,388 680,449 714,007 763,082 6.5 6.5 6.5 6.6
Iowa ................ 92,891 97,810 102,400 114,269 0.9 0.9 0.9 1.0
Kansas .............. 87,206 89,875 93,263 99,090 0.9 0.9 0.9 0.9
Minnesota ........... 190,567 199,271 210,184 225,625 1.9 1.9 1.9 1.9
Missouri ............ 182,048 187,090 193,828 203,208 1.8 1.8 1.8 1.7
Nebraska ............ 57,771 60,571 65,399 67,891 0.6 0.6 0.6 0.6
North Dakota ........ 18,800 20,007 21,597 23,581 0.2 0.2 0.2 0.2
South Dakota ........ 24,104 25,826 27,337 29,419 0.2 0.2 0.3 0.3
Southeast ............. 2,209,061 2,298,332 2,422,079 2,581,437 22.0 22.1 22.2 22.2
Alabama ............. 118,263 123,763 130,792 138,534 1.2 1.2 1.2 1.2
Arkansas ............ 68,574 71,221 74,540 80,056 0.7 0.7 0.7 0.7
Florida ............. 496,861 522,340 553,709 594,525 4.9 5.0 5.1 5.1
Georgia ............. 299,507 307,443 321,199 340,719 3.0 3.0 2.9 2.9
Kentucky ............ 116,545 121,633 128,315 135,412 1.2 1.2 1.2 1.2
Louisiana ........... 137,567 134,360 144,321 151,993 1.4 1.3 1.3 1.3
Mississippi ......... 65,725 68,550 71,872 76,205 0.7 0.7 0.7 0.7
North Carolina ...... 287,281 301,254 315,456 335,398 2.9 2.9 2.9 2.9
South Carolina ...... 117,779 122,274 127,963 135,253 1.2 1.2 1.2 1.2
Tennessee ........... 180,232 191,394 203,071 216,939 1.8 1.8 1.9 1.9
Virginia ............ 277,214 288,840 304,116 326,630 2.8 2.8 2.8 2.8
West Virginia ....... 43,512 45,259 46,726 49,774 0.4 0.4 0.4 0.4
Southwest ............. 1,059,186 1,097,268 1,163,460 1,248,772 10.5 10.5 10.7 10.7
Arizona ............. 164,263 173,052 183,272 199,660 1.6 1.7 1.7 1.7
New Mexico .......... 50,908 53,414 57,078 60,940 0.5 0.5 0.5 0.5
Oklahoma ............ 92,609 95,343 101,168 107,236 0.9 0.9 0.9 0.9
Texas ............... 751,405 775,459 821,943 880,936 7.5 7.4 7.5 7.6
Rocky Mountain ........ 326,361 337,408 353,292 377,666 3.2 3.2 3.2 3.2
Colorado ............ 177,526 181,246 188,397 199,953 1.8 1.7 1.7 1.7
Idaho ............... 36,571 38,276 40,358 43,351 0.4 0.4 0.4 0.4
Montana ............. 22,636 23,913 25,584 27,701 0.2 0.2 0.2 0.2
Utah ................ 70,490 73,646 76,674 82,353 0.7 0.7 0.7 0.7
Wyoming ............. 19,138 20,326 22,279 24,308 0.2 0.2 0.2 0.2
Far West .............. 1,792,059 1,868,597 1,971,337 2,115,111 17.8 17.9 18.0 18.2
Alaska .............. 27,358 29,741 31,704 33,876 0.3 0.3 0.3 0.3
California .......... 1,307,880 1,363,577 1,438,134 1,543,835 13.0 13.1 13.2 13.3
Hawaii .............. 41,720 43,806 46,671 50,134 0.4 0.4 0.4 0.4
Nevada .............. 78,092 82,389 89,711 99,372 0.8 0.8 0.8 0.9
Oregon .............. 111,352 115,113 119,973 128,126 1.1 1.1 1.1 1.1
Washington .......... 225,656 233,971 245,143 259,768 2.2 2.2 2.2 2.2
* Prototype estimates
Source: U.S. Bureau of Economic Analysis
Table 3. Contributions to Percent Change in Real Gross State Product, 2002 - 2003
Percentage points
Percent ------------------------------------------------------------------------------------------------------------------------------------------------------
change Natural Con- Durable Nondurable Trans- Infor- Financial Professional Education Leisure and Other
in real gross resources struction goods manu- goods manu- Trade portation mation activities and business and health hospitality services Government
state and facturing facturing and utilities services services
product mining
United States ...... 2.8 -0.03 -0.01 0.44 0.13 0.28 0.26 0.25 0.65 0.39 0.21 0.07 0.01 0.14
New England ............ 2.6 0.02 -0.06 0.44 0.16 0.33 0.17 0.17 0.75 0.36 0.23 0.06 0.01 -0.04
Connecticut .......... 2.5 0.01 -0.03 0.07 0.14 0.13 0.17 0.25 1.33 0.47 0.12 0.05 0.00 -0.19
Maine ................ 2.7 0.10 0.21 0.16 0.22 0.82 0.14 0.20 0.12 0.09 0.29 0.09 0.06 0.17
Massachusetts ........ 2.2 0.02 -0.21 0.66 0.18 0.29 0.13 0.07 0.59 0.21 0.26 0.05 0.00 -0.06
New Hampshire ........ 3.1 0.03 -0.03 0.86 0.06 0.58 0.35 0.15 0.08 0.37 0.33 0.10 0.01 0.25
Rhode Island ......... 4.3 0.01 0.45 -0.01 0.13 0.53 0.26 0.48 1.03 1.18 0.22 0.11 0.01 -0.05
Vermont .............. 4.3 0.04 0.17 0.83 0.08 0.68 0.41 0.34 0.49 0.48 0.35 0.05 0.06 0.35
Mideast ................ 2.9 0.00 -0.03 0.17 0.22 0.35 0.27 0.31 0.81 0.38 0.25 0.06 0.03 0.05
Delaware ............. 5.4 0.08 -0.01 0.30 1.37 0.53 0.06 0.11 2.38 0.32 0.22 0.02 0.04 -0.02
District of Columbia.. 2.5 -0.01 0.03 0.01 -0.01 0.14 0.13 0.51 0.87 0.65 0.07 0.10 -0.01 0.00
Maryland ............. 3.0 0.05 0.07 0.18 0.05 0.29 0.24 0.17 0.90 0.73 0.26 0.11 0.05 -0.05
New Jersey ........... 2.4 -0.01 -0.10 0.23 0.36 0.33 0.36 0.09 0.48 0.14 0.18 0.09 0.04 0.22
New York ............. 3.1 0.00 -0.03 0.16 0.13 0.31 0.22 0.45 1.06 0.39 0.30 0.06 0.03 0.00
Pennsylvania ......... 2.6 0.00 -0.01 0.15 0.25 0.48 0.33 0.31 0.40 0.39 0.22 0.03 0.04 0.06
Great Lakes ............ 1.9 0.05 -0.10 0.59 0.14 0.12 0.24 0.17 0.19 0.34 0.16 0.03 -0.01 -0.01
Illinois ............. 0.9 0.04 -0.07 0.18 0.01 0.00 0.15 0.18 0.19 0.25 0.13 0.03 0.00 -0.16
Indiana .............. 3.2 0.25 -0.01 0.92 0.23 0.36 0.27 0.18 0.41 0.27 0.17 0.07 0.01 0.09
Michigan ............. 2.2 -0.03 -0.22 0.99 0.23 0.15 0.36 0.18 -0.10 0.48 0.16 0.01 -0.03 0.01
Ohio ................. 1.7 0.03 -0.11 0.53 0.16 0.13 0.21 0.15 0.11 0.31 0.16 0.01 -0.03 0.07
Wisconsin ............ 2.9 0.01 0.01 0.70 0.18 0.07 0.26 0.21 0.61 0.41 0.25 0.06 0.00 0.11
Plains ................. 2.8 0.33 0.00 0.41 0.06 0.26 0.21 0.26 0.63 0.23 0.20 0.04 0.01 0.11
Iowa ................. 2.5 -0.61 0.06 0.57 0.34 0.07 0.33 0.24 1.11 0.32 0.10 0.02 -0.01 -0.02
Kansas ............... 1.2 0.27 -0.07 -0.56 0.01 0.07 0.27 0.64 0.06 0.11 0.10 0.02 0.02 0.28
Minnesota ............ 3.6 0.02 0.01 0.83 0.05 0.42 0.31 0.09 1.24 0.24 0.31 0.08 0.00 -0.05
Missouri ............. 1.7 0.27 -0.08 0.35 -0.14 0.20 0.02 0.23 0.34 0.27 0.11 0.01 0.01 0.11
Nebraska ............. 5.3 2.43 0.11 0.23 0.30 0.30 0.22 0.35 0.40 0.18 0.33 0.07 0.10 0.31
North Dakota ......... 4.6 0.93 0.22 0.44 0.11 0.83 0.34 0.38 0.04 0.41 0.26 0.06 0.06 0.52
South Dakota ......... 3.7 1.58 0.13 0.88 0.13 0.42 0.13 0.23 -0.64 0.07 0.43 0.06 -0.03 0.32
Southeast .............. 3.2 0.00 0.04 0.26 0.14 0.39 0.31 0.24 0.63 0.49 0.21 0.10 0.03 0.38
Alabama .............. 3.8 0.25 0.00 0.46 0.14 0.41 0.47 -0.01 0.42 0.72 0.07 0.07 0.00 0.79
Arkansas ............. 2.5 0.27 -0.37 0.27 0.21 0.39 0.31 0.37 0.15 0.44 0.24 0.03 0.00 0.15
Florida .............. 4.0 -0.12 0.23 0.21 0.06 0.50 0.37 0.30 1.14 0.60 0.28 0.15 0.05 0.27
Georgia .............. 2.8 0.26 0.02 0.09 0.17 0.02 0.27 0.32 0.61 0.32 0.16 0.04 0.02 0.47
Kentucky ............. 3.6 0.00 0.05 0.62 0.42 0.26 0.40 0.11 0.23 0.40 0.22 0.03 0.04 0.87
Louisiana ............ 0.1 -0.82 -0.05 0.00 -0.10 0.15 0.01 0.08 0.14 0.25 0.13 0.08 0.02 0.22
Mississippi .......... 2.2 0.58 -0.28 0.18 0.03 0.38 0.35 0.02 -0.01 0.31 0.26 0.01 0.03 0.33
North Carolina ....... 3.1 0.04 -0.09 0.21 0.25 0.55 0.32 0.22 0.43 0.41 0.18 0.09 0.00 0.51
South Carolina ....... 3.0 0.24 0.07 0.43 0.28 0.48 0.36 0.18 0.17 0.43 0.16 0.13 0.01 0.09
Tennessee ............ 4.4 0.04 0.10 0.53 0.24 0.68 0.28 0.20 0.72 0.25 0.36 0.17 0.02 0.79
Virginia ............. 3.4 0.08 0.07 0.27 0.05 0.37 0.23 0.38 0.91 0.85 0.12 0.09 0.04 0.00
West Virginia ........ 1.1 -0.21 -0.24 -0.10 -0.01 0.19 0.52 0.26 -0.07 0.30 0.16 0.12 0.01 0.14
Southwest .............. 2.4 -0.30 -0.04 0.60 0.00 0.15 0.30 0.15 0.54 0.39 0.25 0.04 -0.01 0.28
Arizona .............. 4.5 -0.23 0.09 1.05 0.10 0.49 0.43 0.15 0.93 0.62 0.50 0.06 0.00 0.31
New Mexico ........... 3.2 -0.22 0.12 1.59 -0.03 0.11 0.37 0.14 -0.09 0.48 0.34 0.03 0.03 0.35
Oklahoma ............. 2.1 0.40 0.00 0.31 0.13 0.11 0.22 0.16 0.27 0.39 0.16 -0.03 -0.02 0.02
Texas ................ 1.8 -0.41 -0.08 0.47 -0.03 0.08 0.28 0.15 0.53 0.34 0.19 0.04 -0.01 0.30
Rocky Mountain ......... 2.4 0.10 -0.18 0.50 0.09 0.18 0.20 0.27 0.58 0.38 0.17 -0.04 -0.01 0.20
Colorado ............. 2.1 0.28 -0.35 0.38 0.09 -0.05 0.20 0.34 0.58 0.32 0.12 -0.02 -0.03 0.22
Idaho ................ 3.8 -0.42 -0.04 1.90 0.07 0.67 0.08 0.20 0.57 0.51 0.24 -0.01 0.00 0.07
Montana .............. 3.9 -0.03 0.43 -0.08 0.05 0.49 0.43 0.22 0.74 0.54 0.23 0.18 0.04 0.62
Utah ................. 2.2 0.02 -0.09 0.34 0.20 0.35 0.00 0.18 0.68 0.43 0.22 -0.22 0.00 0.04
Wyoming .............. 2.1 0.02 -0.08 0.17 -0.18 0.30 0.83 0.14 0.03 0.20 0.24 0.11 -0.01 0.32
Far West ............... 3.4 -0.19 0.07 0.66 0.12 0.29 0.22 0.35 0.98 0.42 0.23 0.13 0.01 0.05
Alaska ............... -2.1 -5.17 0.31 0.05 0.10 0.30 0.22 0.11 0.77 0.17 0.48 0.15 -0.02 0.43
California ........... 3.4 -0.15 0.06 0.78 0.19 0.25 0.21 0.37 1.01 0.34 0.23 0.12 0.01 0.00
Hawaii ............... 3.8 -0.07 0.28 0.03 -0.03 0.77 0.15 0.07 0.85 0.67 0.30 0.40 0.06 0.31
Nevada ............... 7.0 0.10 0.68 0.28 0.07 0.75 0.85 0.11 1.58 1.27 0.30 0.54 0.05 0.39
Oregon ............... 2.8 0.05 -0.21 1.70 0.12 0.19 0.18 0.22 0.35 0.24 0.21 0.03 0.01 -0.29
Washington ........... 2.8 -0.02 -0.02 -0.23 -0.21 0.37 0.13 0.50 0.98 0.72 0.17 0.08 -0.01 0.31
Source: U.S. Bureau of Economic Analysis
Table 4. Revisions to Gross State Product Growth Rates
Real chained (2000) dollars Current dollars
1998-2002* 2003
------------------------------ ------------------------------------------------
Previously Revised Difference Previously Rank Revised Rank Difference
published (percentage published (percentage
points) points)
United States ..... 2.7 2.7 0.0 4.8 ...... 4.9 ...... 0.1
New England ........... 3.1 2.9 -0.2 4.0 ...... 4.0 ...... 0.0
Connecticut ......... 1.7 1.5 -0.2 4.0 42 4.1 42 0.1
Maine ............ 2.8 2.5 -0.3 4.9 27 4.6 33 -0.3
Massachusetts ....... 3.8 3.6 -0.2 3.2 49 3.5 47 0.3
New Hampshire ....... 3.4 3.0 -0.4 5.6 16 4.5 34 -1.1
Rhode Island ........ 3.1 3.1 0.0 7.0 6 6.3 11 -0.7
Vermont ............ 3.8 3.8 0.0 5.4 19 5.8 18 0.4
Mideast ............ 2.6 2.6 0.0 4.4 ...... 4.6 ...... 0.2
Delaware ............ 3.4 3.4 0.0 4.2 40 7.4 5 3.2
District of Columbia 3.2 3.2 0.0 4.9 ...... 5.2 ...... 0.3
Maryland ............ 3.3 3.4 0.1 5.2 22 5.0 25 -0.2
New Jersey .......... 2.9 2.8 -0.1 4.6 35 4.3 39 -0.3
New York ............ 2.5 2.7 0.2 3.7 48 4.4 38 0.7
Pennsylvania ........ 1.9 1.8 -0.1 4.9 30 4.4 37 -0.5
Great Lakes ........... 1.2 1.1 -0.1 3.7 ...... 3.6 ...... -0.1
Illinois ........... 1.4 1.4 0.0 2.7 50 2.8 50 0.1
Indiana ............ 1.4 1.3 -0.1 4.5 37 4.9 26 0.4
Michigan ............ 1.1 0.9 -0.2 4.0 43 3.6 46 -0.4
Ohio ............... 0.6 0.5 -0.1 3.8 46 3.4 48 -0.4
Wisconsin ........... 2.2 2.1 -0.1 4.9 28 4.5 35 -0.4
Plains ............ 2.0 2.0 0.0 5.1 ...... 4.9 ...... -0.2
Iowa .............. 1.8 1.9 0.1 4.9 29 4.7 30 -0.2
Kansas .............. 1.8 1.9 0.1 4.3 39 3.8 44 -0.5
Minnesota ........... 2.9 2.7 -0.2 5.4 20 5.5 21 0.1
Missouri ............ 1.4 1.2 -0.2 3.8 47 3.6 45 -0.2
Nebraska ............ 1.9 1.7 -0.2 7.9 4 8.0 3 0.1
North Dakota ........ 1.3 1.3 0.0 8.0 3 8.0 4 0.0
South Dakota ........ 3.3 4.0 0.7 6.3 9 5.8 17 -0.5
Southeast ............ 2.5 2.4 -0.1 5.2 ...... 5.4 ...... 0.2
Alabama ............. 1.8 1.8 0.0 5.2 21 5.7 19 0.5
Arkansas ............ 1.7 1.6 -0.1 5.0 26 4.7 31 -0.3
Florida ............. 3.4 3.5 0.1 5.7 14 6.0 14 0.3
Georgia ............. 2.6 2.6 0.0 4.6 33 4.5 36 -0.1
Kentucky ............ 0.4 0.4 0.0 5.5 18 5.5 20 0.0
Louisiana ........... -0.8 -1.0 -0.2 6.5 8 7.4 6 0.9
Mississippi ......... 0.8 0.8 0.0 4.6 34 4.8 27 0.2
North Carolina ...... 3.5 3.4 -0.1 4.7 32 4.7 29 0.0
South Carolina ...... 2.1 2.0 -0.1 4.0 41 4.7 32 0.7
Tennessee ........... 1.9 2.2 0.3 5.1 25 6.1 13 1.0
Virginia ............ 4.0 3.7 -0.3 5.9 11 5.3 24 -0.6
West Virginia ....... 0.7 1.0 0.3 3.8 45 3.2 49 -0.6
Southwest ............ 3.4 3.4 0.0 5.3 ...... 6.0 ...... 0.7
Arizona ............ 4.8 5.0 0.2 6.1 10 5.9 16 -0.2
New Mexico .......... 3.4 3.4 0.0 5.6 15 6.9 8 1.3
Oklahoma ............ 2.0 2.0 0.0 5.5 17 6.1 12 0.6
Texas .......... 3.2 3.3 0.1 5.1 24 6.0 15 0.9
Rocky Mountain ........ 3.9 3.9 0.0 4.8 ...... 4.7 ...... -0.1
Colorado ............ 4.2 4.2 0.0 4.3 38 3.9 43 -0.4
Idaho ........... 5.8 5.6 -0.2 4.8 31 5.4 23 0.6
Montana ............. 2.1 2.4 0.3 7.3 5 7.0 7 -0.3
Utah .......... 2.6 2.7 0.1 3.8 44 4.1 41 0.3
Wyoming ........... 4.4 4.7 0.3 9.8 1 9.6 1 -0.2
Far West .......... 4.0 4.0 0.0 5.7 ...... 5.5 ...... -0.2
Alaska ........... 2.2 1.7 -0.5 5.7 13 6.6 9 0.9
California .......... 4.5 4.5 0.0 5.7 12 5.5 22 -0.2
Hawaii ............. 1.4 1.1 -0.3 7.0 7 6.5 10 -0.5
Nevada ............. 3.5 3.8 0.3 8.1 2 8.9 2 0.8
Oregon ............. 2.9 2.8 -0.1 4.5 36 4.2 40 -0.3
Washington .......... 2.4 2.4 0.0 5.1 23 4.8 28 -0.3
Mean 2.5 2.5 0.0 5.2 ...... 5.3 ...... 0.1
Mean(absolute value) 2.5 2.5 0.1 5.2 ...... 5.3 ...... 0.5
* Average annual growth rate
Source: U.S. Bureau of Economic Analysis