
News Release
Advance 2005 and Revised 1998-2004 Gross State Product (GSP) Estimates
Available for this release: Full Release (PDF -) | Tables (XLS - ), Highlights (PDF - )
Sign up for e-mail subscriptions.
| Clifford Woodruff: |
(202) 606–9234
|
BEA 06—23 |
| Sharon Panek |
(202) 606–9228
|
|
| News Media: | ||
| Ralph Stewart, BEA | (202) 606-9690 | |
| Thomas Dail, BEA | (202) 606-9209 | |
| E–mail inquiries: |
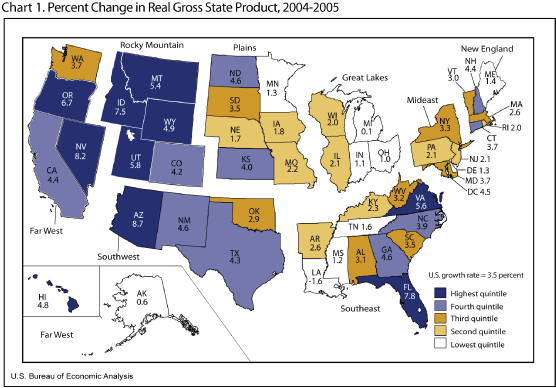
WESTERN STATES LED ECONOMIC GROWTH IN 2005
Advance 2005 and Revised 1998–2004 Gross State Product (GSP) Estimates
U.S. economic growth was widespread in 2005, as GSP grew in 49 of 50 states and the District of Columbia, according to estimates released today by the U.S. Bureau of Economic Analysis1. Eight of the ten fastest–growing states are west of the Mississippi River2. However, as compared to 2004, growth slowed for the nation and most states.
Highlights for 2005
- Growth in real U.S. GSP slowed from 4.2 percent in 2004 to 3.5 percent in 2005; most states' growth slowed as well.
- The services–producing sector continued its expansion with financial activities being the largest contributor to growth. The information–communications–technology–producing industries continued to experience double–digit growth. Most of the fastest–growing states have large concentrations in one or both of these sectors.
- Real GSP grew in all states except Louisiana. The decline in Louisiana was due to the effects of Hurricanes Katrina and Rita.
- Six of the fastest–growing states–Florida, Idaho, Nevada, Oregon, Utah, and Virginia–were also among the fastest–growing states in 2004.
2Seven coterminous states plus Hawaii.
Industry Detail for 2004
Newly available detailed industry information for 2004 confirm the overall pattern of growth by region and broad industry sector reported in October 2005. At the industry level:
- Growth in services–producing industries was strong in nearly all states.
- The largest contributor to growth for 41 states was one of the following three broad industry categories–financial activities, trade, or durable goods manufacturing.
- Many of the slowest–growing states, had declines in the manufacturing, and natural resources and mining industries.
Revisions to the Estimates for 1998–2004
- The revisions in GSP are primarily due to the incorporation of new data from the Economic Census for 2002, and the Annual Survey of Manufacturers (ASM) for 2003 and 2004.
- Overall, the revisions had a moderate impact on relative growth across states. The first–time accelerated industry estimates for 2004, released in October 2005, indicated successfully whether a state's growth was high or low (relative to national growth) for 71 percent of the states.
Tables 1–4 show these results in more detail; complete detail is available on BEA's web site at www.bea.gov
Advance 2005 GSP Estimates
For the second year, BEA is releasing advance GSP estimates. The 2005 estimates are based on BEA earnings–by–industry estimates released March 28, 2006 and on advance GDP–by–industry estimates released April 27, 2006. More information on the methodology used to produce the advance 2005 estimates, on the regular (revised) GSP estimates for 1998–2004, and on revisions to the GSP estimates will appear in an article in the July 2006 issue of the Survey of Current Business, BEA's monthly journal.
In October 2006, BEA plans to release revised 2005 GSP totals and both current– and real–dollar NAICS sector–level GSP estimates for 2005.
BEA is interested in your comments
BEA is interested in your views on the methodology for the advance estimates, the appropriate level of industry detail, and the tradeoff between accuracy and timeliness. We encourage your feedback on the value of this initiative in BEA's Strategic Plan. Please e–mail your comments to BEA's Associate Director for Regional Economics, John W. Ruser, at gspread@bea.gov.
Explanatory Notes
Definitions
GSP is the state counterpart of the Nation's gross domestic product (GDP), the Bureau's featured and most comprehensive measure of U.S. economic activity. GSP for a state is derived as the sum of the GSP originating in all the industries in the state.
Real GSP is an inflation–adjusted measure of each state's gross product that is based on national prices for the goods and services produced within that state. The estimates of real GSP and of quantity indexes with a base year of 2000 are derived by applying national implicit price deflators to the current–dollar GSP estimates for the 63 SIC industries for years 1977–1997, and for the 81 NAICS industries for years 1997 forward. Then, the chain–type index formula that is used in the national accounts is used to calculate the estimates of total real GSP and of real GSP at more aggregated industry levels.
The relation of GSP to Gross Domestic Product (GDP)
An industry's GSP, or its value added, is equal to its gross output (sales or receipts and other operating income, commodity taxes, and inventory change) minus its intermediate inputs (consumption of goods and services purchased from other U.S. industries or imported). The GSP accounts provide data by industry and state that are consistent with gross domestic product (GDP) in the national income and product accounts, and with the GDP by industry accounts.
However, for the NAICS–based GSP estimates for years 1997 forward, total GSP for the Nation differs from GDP in the national income and product accounts for two reasons. First, GSP excludes, and GDP and GDP by industry include, compensation of Federal civilian and military personnel stationed abroad and government consumption of fixed capital for military structures located abroad and for military equipment except domestically located office equipment. Second, GSP and GDP often have different revision schedules.
For the SIC–based GSP estimates for years 1963–1997, there is a third reason why U.S. GSP differs from GDP for the Nation. Like the national estimates of GDP by industry, GSP is measured as the sum of the distributions by industry of the components of gross domestic income, which differs from GDP by the statistical discrepancy. For 1997 forward, the statistical discrepancy is distributed among all private industries. This is not done for the SIC–based estimates.
Tables 1–4. are available in the PDF version of this news release and also in XLS format.
Table 1. Real Gross State Product, 2001-2005
-----------------------------------------------------------------------------------------------------------------------------------
Millions of chained (2000) dollars Percent change
------------------------------------------------------------- ----------------------------------------
2001 2002 2003 2004 2005* 2002 2003 2004 2005* 2005 Rank*
United States 9,836,576 9,981,850 10,237,201 10,662,196 11,035,627 1.5 2.6 4.2 3.5 .......
New England 570,313 568,750 581,648 605,270 623,129 -0.3 2.3 4.1 3.0 .......
Connecticut 161,197 158,628 159,751 166,850 173,058 -1.6 0.7 4.4 3.7 20
Maine 36,176 36,719 37,426 39,184 39,741 1.5 1.9 4.7 1.4 42
Massachusetts 276,634 274,997 282,375 292,423 299,992 -0.6 2.7 3.6 2.6 30
New Hampshire 43,584 44,573 46,063 48,533 50,675 2.3 3.3 5.4 4.4 14
Rhode Island 34,176 34,918 36,439 37,792 38,554 2.2 4.4 3.7 2.0 38
Vermont 18,543 18,909 19,606 20,482 21,103 2.0 3.7 4.5 3.0 28
Mideast 1,837,163 1,851,979 1,887,783 1,961,319 2,017,208 0.8 1.9 3.9 2.8 .......
Delaware 42,966 42,939 44,655 46,981 47,615 -0.1 4.0 5.2 1.3 43
District of Columbia 61,569 62,825 64,270 67,313 70,347 2.0 2.3 4.7 4.5 .......
Maryland 187,483 193,490 199,143 208,534 216,186 3.2 2.9 4.7 3.7 22
New Jersey 355,106 357,923 366,325 377,564 385,494 0.8 2.3 3.1 2.1 36
New York 794,392 791,689 802,823 839,286 867,070 -0.3 1.4 4.5 3.3 25
Pennsylvania 395,633 402,978 410,364 421,443 430,310 1.9 1.8 2.7 2.1 35
Great Lakes 1,525,283 1,553,618 1,592,373 1,624,738 1,645,808 1.9 2.5 2.0 1.3 .......
Illinois 464,910 466,150 478,391 489,042 499,456 0.3 2.6 2.2 2.1 34
Indiana 190,327 196,828 204,837 211,745 214,093 3.4 4.1 3.4 1.1 46
Michigan 326,869 336,862 344,942 342,371 342,656 3.1 2.4 -0.7 0.1 49
Ohio 365,735 373,457 379,439 390,882 394,927 2.1 1.6 3.0 1.0 47
Wisconsin 177,434 180,330 184,777 190,597 194,489 1.6 2.5 3.1 2.0 37
Plains 634,482 650,187 669,180 691,650 706,729 2.5 2.9 3.4 2.2 .......
Iowa 89,360 92,821 95,562 99,780 101,543 3.9 3.0 4.4 1.8 39
Kansas 83,898 85,259 86,360 89,092 92,685 1.6 1.3 3.2 4.0 18
Minnesota 186,336 191,116 198,041 207,196 209,929 2.6 3.6 4.6 1.3 44
Missouri 177,810 179,918 183,500 188,193 192,241 1.2 2.0 2.6 2.2 33
Nebraska 55,819 56,942 60,089 60,751 61,786 2.0 5.5 1.1 1.7 40
North Dakota 17,907 18,818 19,905 19,964 20,879 5.1 5.8 0.3 4.6 12
South Dakota 23,351 25,312 25,722 26,735 27,670 8.4 1.6 3.9 3.5 24
Southeast 2,145,770 2,183,214 2,249,395 2,355,601 2,457,082 1.7 3.0 4.7 4.3 .......
Alabama 115,599 118,185 121,998 128,267 132,213 2.2 3.2 5.1 3.1 27
Arkansas 66,982 68,901 70,737 74,988 76,918 2.9 2.7 6.0 2.6 31
Florida 484,886 497,343 518,753 552,665 595,846 2.6 4.3 6.5 7.8 3
Georgia 292,832 294,105 299,504 313,144 327,451 0.4 1.8 4.6 4.6 13
Kentucky 112,166 115,492 118,246 121,738 124,534 3.0 2.4 3.0 2.3 32
Louisiana 129,233 129,740 131,625 137,524 135,362 0.4 1.5 4.5 -1.6 50
Mississippi 63,963 64,569 66,914 68,830 69,672 0.9 3.6 2.9 1.2 45
North Carolina 278,277 282,389 288,561 296,725 308,402 1.5 2.2 2.8 3.9 19
South Carolina 114,055 115,713 119,337 120,110 124,343 1.5 3.1 0.6 3.5 23
Tennessee 176,253 183,153 189,752 199,816 203,089 3.9 3.6 5.3 1.6 41
Virginia 269,620 271,184 281,083 297,471 314,085 0.6 3.7 5.8 5.6 7
West Virginia 41,922 42,453 42,880 44,280 45,701 1.3 1.0 3.3 3.2 26
Southwest 1,051,493 1,072,012 1,094,165 1,147,570 1,203,450 2.0 2.1 4.9 4.9 .......
Arizona 163,448 166,860 174,693 181,995 197,774 2.1 4.7 4.2 8.7 1
New Mexico 50,926 51,633 53,681 57,227 59,865 1.4 4.0 6.6 4.6 11
Oklahoma 91,793 92,933 94,781 97,907 100,791 1.2 2.0 3.3 2.9 29
Texas 745,325 760,588 771,082 810,510 845,512 2.0 1.4 5.1 4.3 16
Rocky Mountain 318,046 320,931 327,997 344,138 361,456 0.9 2.2 4.9 5.0 .......
Colorado 174,763 175,484 177,945 184,948 192,639 0.4 1.4 3.9 4.2 17
Idaho 35,220 35,696 36,792 40,508 43,539 1.4 3.1 10.1 7.5 4
Montana 21,670 22,248 23,287 24,182 25,480 2.7 4.7 3.8 5.4 8
Utah 68,275 69,091 70,945 74,814 79,169 1.2 2.7 5.5 5.8 6
Wyoming 18,114 18,395 18,985 19,695 20,655 1.6 3.2 3.7 4.9 9
Far West 1,753,966 1,781,052 1,834,540 1,931,577 2,019,884 1.5 3.0 5.3 4.6 .......
Alaska 25,763 28,022 27,713 29,710 29,878 8.8 -1.1 7.2 0.6 48
California 1,281,733 1,298,750 1,340,162 1,409,228 1,471,045 1.3 3.2 5.2 4.4 15
Hawaii 40,626 41,093 42,575 44,683 46,806 1.1 3.6 5.0 4.8 10
Nevada 75,131 77,081 82,771 89,264 96,585 2.6 7.4 7.8 8.2 2
Oregon 110,513 115,000 116,894 128,085 136,619 4.1 1.6 9.6 6.7 5
Washington 220,190 221,115 224,443 230,722 239,281 0.4 1.5 2.8 3.7 21
-----------------------------------------------------------------------------------------------------------------------------------
* Advance estimates
Source: U.S. Bureau of Economic Analysis
Table 2. Gross State Product in Current Dollars, 2002-2005
----------------------------------------------------------------------------------------------------------
Millions of dollars Percent of U.S. total
------------------------------------------------- -----------------------------
2002 2003 2004 2005* 2002 2003 2004 2005*
----------------------------------------------------------------------------------------------------------
United States 10,398,402 10,896,356 11,655,335 12,402,967 100.0 100.0 100.0 100.0
New England 591,733 614,590 654,346 690,690 5.7 5.6 5.6 5.6
Connecticut 166,073 170,235 182,468 194,469 1.6 1.6 1.6 1.6
Maine 38,625 40,197 43,258 45,070 0.4 0.4 0.4 0.4
Massachusetts 284,386 295,938 312,700 328,535 2.7 2.7 2.7 2.6
New Hampshire 46,188 48,380 52,084 55,690 0.4 0.4 0.4 0.4
Rhode Island 36,909 39,260 41,844 43,791 0.4 0.4 0.4 0.4
Vermont 19,553 20,580 21,992 23,134 0.2 0.2 0.2 0.2
Mideast 1,934,602 2,008,885 2,141,348 2,263,453 18.6 18.4 18.4 18.2
Delaware 45,324 48,109 52,298 54,354 0.4 0.4 0.4 0.4
District of Columbia 67,717 71,280 77,510 82,777 0.7 0.7 0.7 0.7
Maryland 204,120 214,488 230,698 244,899 2.0 2.0 2.0 2.0
New Jersey 372,754 388,645 410,306 430,787 3.6 3.6 3.5 3.5
New York 821,577 847,123 906,783 963,466 7.9 7.8 7.8 7.8
Pennsylvania 423,110 439,241 463,752 487,169 4.1 4.0 4.0 3.9
Great Lakes 1,620,354 1,687,538 1,762,697 1,836,745 15.6 15.5 15.1 14.8
Illinois 487,129 509,161 533,735 560,236 4.7 4.7 4.6 4.5
Indiana 205,015 216,650 229,449 238,638 2.0 2.0 2.0 1.9
Michigan 349,837 362,805 366,601 377,895 3.4 3.3 3.1 3.0
Ohio 389,773 402,607 425,173 442,440 3.7 3.7 3.6 3.6
Wisconsin 188,600 196,316 207,739 217,537 1.8 1.8 1.8 1.8
Plains 680,069 714,275 759,984 794,607 6.5 6.6 6.5 6.4
Iowa 97,356 102,358 110,210 114,291 0.9 0.9 0.9 0.9
Kansas 89,573 93,076 98,927 105,448 0.9 0.9 0.8 0.9
Minnesota 198,558 209,335 224,620 233,292 1.9 1.9 1.9 1.9
Missouri 188,351 195,615 205,847 216,069 1.8 1.8 1.8 1.7
Nebraska 59,934 64,789 67,989 70,263 0.6 0.6 0.6 0.6
North Dakota 19,880 21,703 22,692 24,178 0.2 0.2 0.2 0.2
South Dakota 26,416 27,399 29,699 31,066 0.3 0.3 0.3 0.3
Southeast 2,288,917 2,410,162 2,592,632 2,779,264 22.0 22.1 22.2 22.4
Alabama 123,805 130,526 141,366 149,796 1.2 1.2 1.2 1.2
Arkansas 72,203 75,564 82,712 86,802 0.7 0.7 0.7 0.7
Florida 522,719 556,748 609,372 674,049 5.0 5.1 5.2 5.4
Georgia 306,680 317,490 339,730 364,310 2.9 2.9 2.9 2.9
Kentucky 120,726 125,832 133,003 140,359 1.2 1.2 1.1 1.1
Louisiana 134,308 146,105 160,186 166,310 1.3 1.3 1.4 1.3
Mississippi 68,144 72,532 77,107 80,197 0.7 0.7 0.7 0.6
North Carolina 296,435 307,871 323,962 344,641 2.9 2.8 2.8 2.8
South Carolina 121,582 127,459 131,492 139,771 1.2 1.2 1.1 1.1
Tennessee 191,525 201,522 216,769 226,502 1.8 1.8 1.9 1.8
Virginia 285,759 301,867 327,032 352,745 2.7 2.8 2.8 2.8
West Virginia 45,032 46,645 49,903 53,782 0.4 0.4 0.4 0.4
Southwest 1,105,103 1,172,147 1,272,937 1,388,034 10.6 10.8 10.9 11.2
Arizona 171,942 182,414 194,246 215,759 1.7 1.7 1.7 1.7
New Mexico 52,510 57,453 63,645 69,324 0.5 0.5 0.5 0.6
Oklahoma 97,170 103,824 111,838 120,549 0.9 1.0 1.0 1.0
Texas 783,480 828,456 903,208 982,403 7.5 7.6 7.7 7.9
Rocky Mountain 334,649 350,805 379,121 410,350 3.2 3.2 3.3 3.3
Colorado 182,154 188,873 201,392 216,064 1.8 1.7 1.7 1.7
Idaho 36,651 38,468 43,509 47,178 0.4 0.4 0.4 0.4
Montana 23,560 25,477 27,583 29,851 0.2 0.2 0.2 0.2
Utah 72,665 76,180 82,546 89,836 0.7 0.7 0.7 0.7
Wyoming 19,619 21,806 24,092 27,422 0.2 0.2 0.2 0.2
Far West 1,842,975 1,937,953 2,092,270 2,239,824 17.7 17.8 18.0 18.1
Alaska 29,186 31,488 35,988 39,872 0.3 0.3 0.3 0.3
California 1,340,446 1,410,539 1,519,202 1,621,843 12.9 12.9 13.0 13.1
Hawaii 43,476 46,386 50,238 53,710 0.4 0.4 0.4 0.4
Nevada 81,274 89,035 99,143 110,546 0.8 0.8 0.9 0.9
Oregon 117,131 120,480 134,615 145,351 1.1 1.1 1.2 1.2
Washington 231,463 240,025 253,085 268,502 2.2 2.2 2.2 2.2
----------------------------------------------------------------------------------------------------------
* Advance estimates
Source: U.S. Bureau of Economic Analysis
Table 3. Contributions to Percent Change in Real Gross State Product, 2003-2004
----------------------------------------------------------------------------------------------------------------------------------------------------------------------------------------------------------------------------
Percentage points
Percent -----------------------------------------------------------------------------------------------------------------------------------------------------------------------------------
change in Natural Con- Durable Nondurable Trade Trans- Infor- Financial Professional Education Leisure Other Government
real gross resources struction goods manu- goods manu- portation mation activities and business and health and services
state and facturing facturing and services services hospitality
product mining utilities
----------------------------------------------------------------------------------------------------------------------------------------------------------------------------------------------------------------------------
United States 4.2 0.05 0.12 0.45 0.14 0.70 0.14 0.56 0.79 0.73 0.25 0.11 0.03 0.08
New England 4.1 0.00 0.09 0.20 0.12 0.57 0.16 0.49 1.15 0.86 0.23 0.08 0.01 0.10
Connecticut 4.4 -0.02 0.22 0.09 0.82 0.48 0.36 0.49 1.05 0.55 0.16 0.08 0.00 0.16
Maine 4.7 0.05 0.08 0.72 0.40 0.94 0.18 0.37 0.63 0.43 0.53 0.06 0.03 0.27
Massachusetts 3.6 0.01 0.01 0.00 -0.25 0.52 0.03 0.48 1.30 1.15 0.20 0.08 0.00 0.03
New Hampshire 5.4 0.04 0.16 0.58 -0.07 0.82 0.40 0.58 1.20 1.00 0.30 0.16 0.03 0.17
Rhode Island 3.7 0.00 -0.09 0.96 -0.18 0.46 -0.04 0.58 1.20 0.45 0.27 0.04 0.03 0.03
Vermont 4.5 -0.06 0.39 0.48 0.32 0.89 0.06 0.57 0.56 0.61 0.33 0.12 0.03 0.17
Mideast 3.9 -0.01 0.03 0.13 -0.08 0.58 0.05 0.62 1.29 0.80 0.23 0.08 0.04 0.13
Delaware 5.2 0.00 0.26 0.17 2.32 0.59 0.13 0.24 0.07 0.78 0.29 0.14 0.01 0.21
District of Columbia 4.7 -0.01 -0.08 0.03 0.00 0.15 -0.03 0.87 1.08 1.68 0.16 0.09 0.31 0.51
Maryland 4.7 0.01 0.29 0.20 0.08 0.68 -0.05 0.47 1.45 1.13 0.28 0.10 0.04 0.04
New Jersey 3.1 -0.02 0.09 -0.22 0.00 0.35 0.06 0.46 1.26 0.61 0.15 0.03 0.04 0.27
New York 4.5 -0.02 -0.06 0.13 0.08 0.65 0.04 0.86 1.67 0.73 0.22 0.12 0.02 0.08
Pennsylvania 2.7 0.00 0.01 0.42 -0.82 0.67 0.13 0.35 0.70 0.78 0.30 0.04 0.03 0.07
Great Lakes 2.0 0.07 -0.05 0.22 0.22 0.51 0.12 0.36 0.14 0.55 0.18 0.06 0.01 -0.37
Illinois 2.2 0.14 -0.13 0.78 0.23 0.61 0.15 0.40 0.46 0.74 0.13 0.09 0.01 -1.39
Indiana 3.4 0.16 0.02 0.68 0.61 0.49 0.20 0.38 -0.07 0.43 0.21 0.09 0.02 0.14
Michigan -0.7 0.03 -0.07 -1.52 -0.07 0.26 0.03 0.29 -0.17 0.37 0.12 0.02 -0.01 -0.02
Ohio 3.0 -0.01 -0.01 0.80 0.15 0.57 0.15 0.32 0.03 0.60 0.23 0.04 0.02 0.11
Wisconsin 3.1 0.02 0.04 0.29 0.41 0.59 0.10 0.42 0.36 0.43 0.30 0.05 0.02 0.13
Plains 3.4 0.29 0.05 0.84 0.09 0.62 0.04 0.51 -0.05 0.52 0.24 0.05 0.01 0.14
Iowa 4.4 2.12 0.15 1.91 -0.06 0.39 0.25 0.39 -1.42 0.25 0.21 0.02 0.02 0.19
Kansas 3.2 -0.59 -0.04 1.40 -0.22 0.55 -0.05 0.78 0.07 0.64 0.25 0.10 -0.03 0.32
Minnesota 4.6 0.21 0.05 1.09 0.16 0.78 0.17 0.47 0.50 0.76 0.29 0.04 0.02 0.07
Missouri 2.6 0.45 -0.01 -0.02 0.28 0.56 -0.18 0.56 0.11 0.50 0.17 0.05 0.01 0.08
Nebraska 1.1 -0.48 0.04 0.30 -0.19 0.66 0.11 0.29 -0.54 0.36 0.23 0.05 0.04 0.23
North Dakota 0.3 -2.69 0.34 0.14 0.39 0.91 0.07 0.59 0.09 0.34 0.29 0.05 -0.01 -0.23
South Dakota 3.9 0.22 0.08 0.90 0.33 0.70 0.05 0.39 0.41 0.05 0.33 0.06 0.08 0.34
Southeast 4.7 0.07 0.22 0.45 0.07 0.89 0.18 0.52 0.79 0.79 0.29 0.16 0.04 0.26
Alabama 5.1 -0.05 0.09 1.83 0.70 0.88 -0.03 0.46 0.19 0.59 0.31 0.06 0.02 0.10
Arkansas 6.0 0.82 0.06 0.86 0.84 1.03 0.05 0.48 0.51 0.55 0.31 0.09 0.04 0.38
Florida 6.5 -0.06 0.58 0.41 0.08 1.21 0.16 0.63 1.53 0.90 0.34 0.35 0.07 0.32
Georgia 4.6 -0.02 0.15 0.32 0.27 0.81 0.38 0.69 0.79 0.72 0.25 0.09 0.01 0.10
Kentucky 3.0 0.12 -0.07 0.18 0.06 0.77 0.29 0.32 0.36 0.42 0.23 0.08 0.00 0.19
Louisiana 4.5 -0.08 -0.10 0.50 1.65 0.58 0.11 0.37 0.43 0.43 0.24 0.15 0.04 0.18
Mississippi 2.9 0.57 -0.16 0.55 -0.28 0.69 0.28 0.22 0.13 0.28 0.27 0.03 0.00 0.29
North Carolina 2.8 0.20 0.14 0.80 -1.31 0.72 0.17 0.39 0.45 0.59 0.27 0.10 0.02 0.28
South Carolina 0.6 -0.05 0.07 -1.85 -0.22 0.94 -0.07 0.35 0.43 0.45 0.19 0.12 0.03 0.24
Tennessee 5.3 -0.04 0.06 1.02 1.02 0.93 0.21 0.34 0.39 0.77 0.47 0.08 0.00 0.06
Virginia 5.8 0.06 0.35 0.28 -0.32 0.76 0.20 0.77 1.13 1.64 0.23 0.12 0.07 0.54
West Virginia 3.3 0.83 0.23 0.30 -0.35 0.75 0.00 0.18 0.30 0.44 0.27 0.07 0.09 0.15
Southwest 4.9 -0.11 0.05 0.86 0.62 0.81 0.32 0.45 0.42 0.88 0.29 0.10 0.02 0.16
Arizona 4.2 0.22 0.43 -1.24 0.02 1.14 0.20 0.34 1.08 1.02 0.52 0.16 0.03 0.26
New Mexico 6.6 -0.08 0.19 3.32 -0.14 0.82 0.24 0.27 0.30 0.63 0.37 0.09 0.05 0.53
Oklahoma 3.3 0.47 -0.04 0.29 -0.25 0.65 0.28 0.48 0.34 0.53 0.27 0.07 0.01 0.20
Texas 5.1 -0.26 -0.03 1.22 0.91 0.76 0.36 0.48 0.30 0.91 0.24 0.09 0.02 0.11
Rocky Mountain 4.9 0.37 0.16 0.99 -0.01 0.75 0.16 0.46 0.56 0.92 0.25 0.08 0.04 0.20
Colorado 3.9 0.25 0.09 0.58 -0.03 0.52 0.19 0.43 0.41 1.09 0.21 0.06 0.03 0.12
Idaho 10.1 0.62 0.33 4.34 -0.22 1.16 0.16 0.56 1.19 0.99 0.36 0.09 0.05 0.47
Montana 3.8 0.49 0.26 0.06 -0.05 0.94 0.09 0.44 0.57 0.36 0.34 0.12 0.05 0.17
Utah 5.5 0.27 0.30 0.84 0.09 1.08 0.12 0.54 0.67 0.85 0.26 0.09 0.09 0.25
Wyoming 3.7 1.14 -0.14 0.18 0.14 0.68 0.05 0.33 0.46 0.29 0.23 0.13 0.00 0.26
Far West 5.3 0.05 0.29 0.55 0.16 0.75 0.12 0.86 1.29 0.66 0.25 0.18 0.04 0.08
Alaska 7.2 4.56 0.09 0.03 0.08 0.41 0.70 0.40 -0.08 0.33 0.41 0.07 -0.05 0.24
California 5.2 -0.03 0.28 0.34 0.17 0.68 0.09 1.03 1.47 0.65 0.23 0.16 0.04 0.03
Hawaii 5.0 -0.21 0.16 -0.01 -0.13 0.84 0.49 0.46 1.30 0.74 0.27 0.51 0.05 0.48
Nevada 7.8 -0.01 1.16 0.21 0.08 1.13 0.11 0.17 2.14 1.35 0.38 0.54 0.13 0.45
Oregon 9.6 0.03 0.14 6.24 0.39 0.94 -0.01 0.45 0.31 0.42 0.32 0.08 0.05 0.21
Washington 2.8 -0.05 0.17 -0.80 0.08 0.97 0.20 0.45 0.65 0.58 0.28 0.16 0.03 0.08
----------------------------------------------------------------------------------------------------------------------------------------------------------------------------------------------------------------------------
Source: U.S. Bureau of Economic Analysis
Table 4. Revisions to Real Gross State Product Growth Rates
----------------------------------------------------------------------------------------------------------------------------------------------
1998-2002* 2003 2004
------------------------------------ ------------------------------------ ------------------------------------
Previously Revised Difference Previously Revised Difference Previously Revised Difference
published (percentage published (percentage published (percentage
points) points) points)
----------------------------------------------------------------------------------------------------------------------------------------------
United States 2.7 2.6 -0.1 2.8 2.6 -0.2 4.3 4.2 -0.1
New England 2.9 2.7 -0.2 2.6 2.3 -0.3 4.6 4.1 -0.5
Connecticut 1.5 1.3 -0.2 2.5 0.7 -1.8 4.5 4.4 -0.1
Maine 2.5 2.4 -0.1 2.7 1.9 -0.8 3.9 4.7 0.8
Massachusetts 3.6 3.4 -0.2 2.2 2.7 0.5 4.8 3.6 -1.2
New Hampshire 3.0 3.0 0.0 3.1 3.3 0.2 5.4 5.4 0.0
Rhode Island 3.1 3.1 0.0 4.3 4.4 0.1 3.5 3.7 0.2
Vermont 3.8 3.9 0.1 4.3 3.7 -0.6 4.6 4.5 -0.1
Mideast 2.6 2.7 0.1 2.9 1.9 -1.0 4.2 3.9 -0.3
Delaware 3.4 2.5 -0.9 5.4 4.0 -1.4 5.0 5.2 0.2
District of Columbia 3.2 3.3 0.1 2.5 2.3 -0.2 6.2 4.7 -1.5
Maryland 3.4 3.5 0.1 3.0 2.9 -0.1 4.8 4.7 -0.1
New Jersey 2.8 2.4 -0.4 2.4 2.3 -0.1 3.4 3.1 -0.3
New York 2.7 3.2 0.5 3.1 1.4 -1.7 4.7 4.5 -0.2
Pennsylvania 1.8 1.7 -0.1 2.6 1.8 -0.8 3.0 2.7 -0.3
Great Lakes 1.1 1.3 0.2 1.9 2.5 0.6 2.4 2.0 -0.4
Illinois 1.4 1.5 0.1 0.9 2.6 1.7 1.9 2.2 0.3
Indiana 1.3 1.5 0.2 3.2 4.1 0.9 3.8 3.4 -0.4
Michigan 0.9 1.0 0.1 2.2 2.4 0.2 1.2 -0.7 -1.9
Ohio 0.5 0.7 0.2 1.7 1.6 -0.1 2.6 3.0 0.4
Wisconsin 2.1 1.9 -0.2 2.9 2.5 -0.4 4.1 3.1 -1.0
Plains 2.0 2.0 0.0 2.8 2.9 0.1 3.4 3.4 0.0
Iowa 1.9 1.8 -0.1 2.5 3.0 0.5 5.5 4.4 -1.1
Kansas 1.9 1.8 -0.1 1.2 1.3 0.1 3.6 3.2 -0.4
Minnesota 2.7 2.9 0.2 3.6 3.6 0.0 3.9 4.6 0.7
Missouri 1.2 1.2 0.0 1.7 2.0 0.3 2.4 2.6 0.2
Nebraska 1.7 1.5 -0.2 5.3 5.5 0.2 1.5 1.1 -0.4
North Dakota 1.3 1.8 0.5 4.6 5.8 1.2 2.1 0.3 -1.8
South Dakota 4.0 4.7 0.7 3.7 1.6 -2.1 4.5 3.9 -0.6
Southeast 2.4 2.3 -0.1 3.2 3.0 -0.2 4.8 4.7 -0.1
Alabama 1.8 1.6 -0.2 3.8 3.2 -0.6 4.3 5.1 0.8
Arkansas 1.6 1.8 0.2 2.5 2.7 0.2 5.3 6.0 0.7
Florida 3.5 3.4 -0.1 4.0 4.3 0.3 5.9 6.5 0.6
Georgia 2.6 2.5 -0.1 2.8 1.8 -1.0 4.5 4.6 0.1
Kentucky 0.4 0.5 0.1 3.6 2.4 -1.2 3.7 3.0 -0.7
Louisiana -1.0 -0.9 0.1 0.1 1.5 1.4 2.2 4.5 2.3
Mississippi 0.8 0.5 -0.3 2.2 3.6 1.4 3.3 2.9 -0.4
North Carolina 3.4 3.0 -0.4 3.1 2.2 -0.9 4.4 2.8 -1.6
South Carolina 2.0 1.9 -0.1 3.0 3.1 0.1 4.1 0.6 -3.5
Tennessee 2.2 2.2 0.0 4.4 3.6 -0.8 4.7 5.3 0.6
Virginia 3.7 3.4 -0.3 3.4 3.7 0.3 6.3 5.8 -0.5
West Virginia 1.0 1.0 0.0 1.1 1.0 -0.1 2.6 3.3 0.7
Southwest 3.4 3.5 0.1 2.4 2.1 -0.3 4.8 4.9 0.1
Arizona 5.0 4.7 -0.3 4.5 4.7 0.2 7.1 4.2 -2.9
New Mexico 3.4 2.8 -0.6 3.2 4.0 0.8 4.3 6.6 2.3
Oklahoma 2.0 2.4 0.4 2.1 2.0 -0.1 3.3 3.3 0.0
Texas 3.3 3.4 0.1 1.8 1.4 -0.4 4.6 5.1 0.5
Rocky Mountain 3.9 3.7 -0.2 2.4 2.2 -0.2 4.4 4.9 0.5
Colorado 4.2 4.4 0.2 2.1 1.4 -0.7 3.9 3.9 0.0
Idaho 5.6 4.4 -1.2 3.8 3.1 -0.7 5.8 10.1 4.3
Montana 2.4 1.9 -0.5 3.9 4.7 0.8 4.3 3.8 -0.5
Utah 2.7 2.3 -0.4 2.2 2.7 0.5 5.2 5.5 0.3
Wyoming 4.7 3.4 -1.3 2.1 3.2 1.1 3.3 3.7 0.4
Far West 4.0 3.6 -0.4 3.4 3.0 -0.4 5.5 5.3 -0.2
Alaska 1.7 1.1 -0.6 -2.1 -1.1 1.0 3.4 7.2 3.8
California 4.5 4.0 -0.5 3.4 3.2 -0.2 5.6 5.2 -0.4
Hawaii 1.1 0.9 -0.2 3.8 3.6 -0.2 6.0 5.0 -1.0
Nevada 3.8 3.6 -0.2 7.0 7.4 0.4 9.3 7.8 -1.5
Oregon 2.8 3.3 0.5 2.8 1.6 -1.2 4.5 9.6 5.1
Washington 2.4 2.0 -0.4 2.8 1.5 -1.3 4.4 2.8 -1.6
Mean 2.5 2.4 -0.1 2.9 2.8 -0.1 4.3 4.2 0.0
Mean (absolute value) 2.5 2.4 0.3 3.0 2.9 0.7 4.3 4.3 1.0
----------------------------------------------------------------------------------------------------------------------------------------------
* Average annual growth rate
Source: U.S. Bureau of Economic Analysis