
News Release
State Personal Income: Third Quarter 2006
Available for this release: Full Release (PDF - ) | Tables (Excel - ), Highlights (PDF -)
Sign up for e-mail subscriptions.
EMBARGOED FOR RELEASE: 8:30 A.M. ET, Wednesday, December 20, 2006
| David G. Lenze | (202) | 606–9292 | |
| Matthew von Kerczek | (202) | 606–9250 | BEA 06—57 |
| E–mail inquiries: | Reis.remd@bea.gov |
State Personal Income: Third Quarter 2006
U.S. personal income growth in the third quarter grew 1.4 percent (equaling its average growth rate since 2003:1) following a slower 0.8 percent gain in the second quarter, according to estimates released today by the U.S. Bureau of Economic Analysis. Growth picked up in all regions, with the strongest improvements occurring in the Far West and Mideast regions.
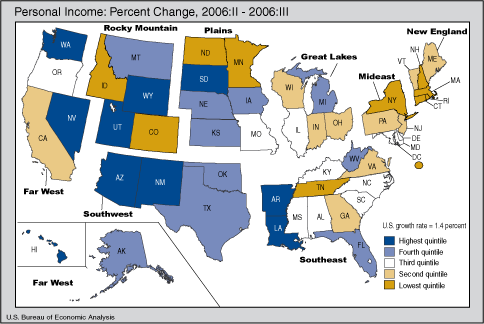
The Southwest region grew faster than the other seven regions in the third quarter, as it has in most of the last seven quarters. Since 2004:4 the Southwest region has grown almost 5 percentage points faster than the nation.
Third-quarter personal income growth in all regions exceeded inflation as measured by the national price index for personal consumption expenditures. The inflation rate fell to 0.6 percent in the third quarter down from 1.0 percent in the second.
Growth by state and industry. Seven of the fastest growing states in the third quarter-Arizona, Louisiana, Nevada, New Mexico, Texas, Utah, and Wyoming-share a still expanding construction sector that contrasts with declining construction earnings in most of the rest of the country. Four of the fastest growing states-Louisiana, New Mexico, Texas, and Wyoming-are also notable for the relatively large contribution to earnings growth made by mining (including oil and gas extraction), a small industry that has sustained a rapid expansion for four years. Mining also made a relatively large contribution to third-quarter earnings growth in Oklahoma, Alaska, and West Virginia.
Personal income growth in the state of Washington (2.6 percent) was the highest of all states. It reflects huge gains from the exercise of stock options by employees in the information industry. The gains are counted as part of earnings which grew 47 percent in that industry in the third quarter. The exercise of stock options in the information industry has frequently propelled Washington to first place in the growth rankings and dropped the state into last place the following quarter.
Louisiana's personal income grew faster than the nation's in the third quarter, the first time this year its recovery from Hurricane Katrina had such a strong effect. The recovery shows up more clearly in earnings which have grown twice as fast in Louisiana than in the US over the last six months. The strong earnings rebound is offset somewhat by weak transfer receipts as disaster assistance and unemployment compensation taper off.
In the third quarter Michigan accounted for almost half of the national gain in earnings in durable goods manufacturing ($1.2 billion out of $2.6 billion) despite a job loss of 3.1 percent. The contrary movements in earnings and jobs primarily reflect the GM and Delphi employee buyouts and are apparent in other Great Lakes states such as Indiana and Ohio as well as in Louisiana and Delaware. Aside from the buyouts, earnings growth in the durable goods industry was generally anemic across the country.
NOTE.–Quarterly estimates are expressed at seasonally adjusted annual rates, unless otherwise specified. Quarter–to–quarter dollar changes are differences between published estimates. Quarter–to–quarter percent changes are calculated from unrounded data and are not annualized.
Definitions
Personal income is the income received by all persons from all sources. Personal income is the sum of net earnings by place of residence, rental income of persons, personal dividend income, personal interest income, and personal current transfer receipts. Net earnings is earnings by place of work (the sum of wage and salary disbursements (payrolls), supplements to wages and salaries, and proprietors' income) less contributions for government social insurance, plus an adjustment to convert earnings by place of work to a place–of–residence basis. Personal income is measured before the deduction of personal income taxes and other personal taxes and is reported in current dollars (no adjustment is made for price changes).
The estimate of personal income in the United States is derived as the sum of the state estimates; it differs from the estimate of personal income in the national income and product accounts (NIPAs) because of differences in coverage, in the methodologies used to prepare the estimates, and in the timing of the availability of source data.
BEA groups all 50 states and the District of Columbia into eight distinct regions for purposes of data collecting and analyses: New England (Connecticut, Maine, Massachusetts, New Hampshire, Rhode Island, and Vermont); Mideast (Delaware, District of Columbia, Maryland, New Jersey, New York, and Pennsylvania); Great Lakes (Illinois, Indiana, Michigan, Ohio, and Wisconsin); Plains (Iowa, Kansas, Minnesota, Missouri, Nebraska, North Dakota, and South Dakota); Southeast (Alabama, Arkansas, Florida, Georgia, Kentucky, Louisiana, Mississippi, North Carolina, South Carolina, Tennessee, Virginia, and West Virginia); Southwest (Arizona, New Mexico, Oklahoma, and Texas); Rocky Mountain (Colorado, Idaho, Montana, Utah, and Wyoming); and Far West (Alaska, California, Hawaii, Nevada, Oregon, and Washington).
BEA's national, international, regional, and industry estimates; the Survey of Current Business; and BEA news releases are available without charge on BEA's Web site at www.bea.gov. By visiting the site, you can also subscribe to receive free e–mail summaries of BEA releases and announcements.
Next state personal income release – March 27, 2007, at 8:30 A.M. ET for state personal income, fourth quarter 2006, annual 2006, and quarterly and annual revisions 2003–2005.
| [Millons of dollars, seasonally adjusted at annual rate] | Percent change from preceding quarter/1 | Rank | ||||||||||
| 2005:II | 2005:III | 2005:IV | 2006:I/r | 2006:II/r | 2006:III/p | 2005:III | 2005:IV | 2006:I | 2006:II | 2006:III | 2006:II-2006:III | |
| r Revised. | p Preliminary. | 1. Percent changes are expressed at quarterly rates. | ||||||||||
| Note: Estimates may not add to totals because of rounding. | Source: U.S. Bureau of Economic Analysis | |||||||||||
| United States | 10,146,966 | 10,248,460 | 10,469,598 | 10,700,889 | 10,788,179 | 10,938,084 | 1.0 | 2.2 | 2.2 | 0.8 | 1.4 | -- |
| New England | ||||||||||||
| Connecticut | 165,097 | 167,969 | 169,737 | 174,275 | 174,004 | 175,728 | 1.7 | 1.1 | 2.7 | -0.2 | 1.0 | 49 |
| Maine | 40,571 | 40,874 | 41,279 | 42,211 | 42,712 | 43,271 | 0.7 | 1.0 | 2.3 | 1.2 | 1.3 | 32 |
| Massachusetts | 276,771 | 281,800 | 285,692 | 291,013 | 293,837 | 297,435 | 1.8 | 1.4 | 1.9 | 1.0 | 1.2 | 42 |
| New Hampshire | 49,269 | 49,942 | 50,376 | 51,465 | 51,721 | 52,218 | 1.4 | 0.9 | 2.2 | 0.5 | 1.0 | 50 |
| Rhode Island | 37,704 | 38,049 | 38,609 | 39,017 | 39,781 | 40,197 | 0.9 | 1.5 | 1.1 | 2.0 | 1.0 | 48 |
| Vermont | 20,229 | 20,555 | 20,692 | 21,106 | 21,075 | 21,342 | 1.6 | 0.7 | 2.0 | -0.1 | 1.3 | 36 |
| Mideast | ||||||||||||
| Delaware | 30,733 | 31,339 | 32,421 | 32,989 | 32,913 | 33,366 | 2.0 | 3.5 | 1.8 | -0.2 | 1.4 | 26 |
| District of Columbia | 30,783 | 31,328 | 31,504 | 32,262 | 32,508 | 32,864 | 1.8 | 0.6 | 2.4 | 0.8 | 1.1 | -- |
| Maryland | 233,004 | 237,110 | 240,561 | 244,803 | 246,765 | 250,125 | 1.8 | 1.5 | 1.8 | 0.8 | 1.4 | 28 |
| New Jersey | 378,835 | 384,623 | 389,388 | 399,849 | 403,873 | 408,943 | 1.5 | 1.2 | 2.7 | 1.0 | 1.3 | 39 |
| New York | 760,912 | 776,615 | 789,174 | 811,715 | 810,892 | 820,831 | 2.1 | 1.6 | 2.9 | -0.1 | 1.2 | 41 |
| Pennsylvania | 430,199 | 435,201 | 441,021 | 448,497 | 452,465 | 458,235 | 1.2 | 1.3 | 1.7 | 0.9 | 1.3 | 35 |
| Great Lakes | ||||||||||||
| Illinois | 458,998 | 465,682 | 472,668 | 484,398 | 488,959 | 495,615 | 1.5 | 1.5 | 2.5 | 0.9 | 1.4 | 29 |
| Indiana | 194,370 | 196,748 | 198,475 | 203,756 | 204,127 | 206,852 | 1.2 | 0.9 | 2.7 | 0.2 | 1.3 | 31 |
| Michigan | 330,416 | 333,008 | 335,339 | 337,292 | 340,311 | 345,298 | 0.8 | 0.7 | 0.6 | 0.9 | 1.5 | 17 |
| Ohio | 363,305 | 366,928 | 371,284 | 376,613 | 380,364 | 385,297 | 1.0 | 1.2 | 1.4 | 1.0 | 1.3 | 34 |
| Wisconsin | 182,840 | 185,348 | 186,786 | 191,142 | 192,048 | 194,472 | 1.4 | 0.8 | 2.3 | 0.5 | 1.3 | 37 |
| Plains | ||||||||||||
| Iowa | 93,455 | 94,956 | 96,103 | 98,388 | 99,503 | 100,915 | 1.6 | 1.2 | 2.4 | 1.1 | 1.4 | 20 |
| Kansas | 89,722 | 90,830 | 92,261 | 94,578 | 95,428 | 96,942 | 1.2 | 1.6 | 2.5 | 0.9 | 1.6 | 13 |
| Minnesota | 189,817 | 193,051 | 194,165 | 198,150 | 199,387 | 201,762 | 1.7 | 0.6 | 2.1 | 0.6 | 1.2 | 43 |
| Missouri | 180,396 | 182,299 | 185,474 | 188,369 | 190,781 | 193,440 | 1.1 | 1.7 | 1.6 | 1.3 | 1.4 | 24 |
| Nebraska | 57,503 | 58,201 | 59,231 | 60,147 | 60,759 | 61,646 | 1.2 | 1.8 | 1.5 | 1.0 | 1.5 | 18 |
| North Dakota | 19,707 | 19,979 | 20,402 | 20,423 | 20,706 | 20,941 | 1.4 | 2.1 | 0.1 | 1.4 | 1.1 | 46 |
| South Dakota | 25,149 | 25,477 | 25,722 | 26,257 | 26,440 | 26,933 | 1.3 | 1.0 | 2.1 | 0.7 | 1.9 | 5 |
| Southeast | ||||||||||||
| Alabama | 133,920 | 135,287 | 139,024 | 141,027 | 143,059 | 145,072 | 1.0 | 2.8 | 1.4 | 1.4 | 1.4 | 21 |
| Arkansas | 73,525 | 74,249 | 75,695 | 77,305 | 78,208 | 79,457 | 1.0 | 1.9 | 2.1 | 1.2 | 1.6 | 10 |
| Florida | 600,346 | 613,711 | 622,772 | 638,698 | 645,599 | 655,850 | 2.2 | 1.5 | 2.6 | 1.1 | 1.6 | 12 |
| Georgia | 280,105 | 284,531 | 290,928 | 295,631 | 297,823 | 301,690 | 1.6 | 2.2 | 1.6 | 0.7 | 1.3 | 33 |
| Kentucky | 117,558 | 118,973 | 120,413 | 121,595 | 123,172 | 124,892 | 1.2 | 1.2 | 1.0 | 1.3 | 1.4 | 23 |
| Louisiana | 125,620 | 63,460 | 131,147 | 131,129 | 132,220 | 134,470 | -49.5 | 106.7 | 0.0 | 0.8 | 1.7 | 8 |
| Mississippi | 72,388 | 70,551 | 76,703 | 76,259 | 76,818 | 77,858 | -2.5 | 8.7 | -0.6 | 0.7 | 1.4 | 30 |
| North Carolina | 267,328 | 270,894 | 274,031 | 280,393 | 282,137 | 286,018 | 1.3 | 1.2 | 2.3 | 0.6 | 1.4 | 27 |
| South Carolina | 119,280 | 120,794 | 122,507 | 125,592 | 126,680 | 128,432 | 1.3 | 1.4 | 2.5 | 0.9 | 1.4 | 25 |
| Tennessee | 182,905 | 185,880 | 189,148 | 190,917 | 194,735 | 196,925 | 1.6 | 1.8 | 0.9 | 2.0 | 1.1 | 47 |
| Virginia | 282,285 | 286,675 | 289,043 | 296,189 | 298,152 | 301,911 | 1.6 | 0.8 | 2.5 | 0.7 | 1.3 | 38 |
| West Virginia | 47,016 | 47,539 | 48,099 | 49,028 | 49,596 | 50,362 | 1.1 | 1.2 | 1.9 | 1.2 | 1.5 | 14 |
| Southwest | ||||||||||||
| Arizona | 176,955 | 182,481 | 183,942 | 191,401 | 192,006 | 195,446 | 3.1 | 0.8 | 4.1 | 0.3 | 1.8 | 7 |
| New Mexico | 53,399 | 54,196 | 54,980 | 56,490 | 57,341 | 58,538 | 1.5 | 1.4 | 2.7 | 1.5 | 2.1 | 2 |
| Oklahoma | 104,958 | 106,645 | 108,862 | 112,928 | 114,214 | 115,897 | 1.6 | 2.1 | 3.7 | 1.1 | 1.5 | 16 |
| Texas | 735,938 | 751,026 | 768,540 | 786,862 | 798,973 | 811,684 | 2.1 | 2.3 | 2.4 | 1.5 | 1.6 | 11 |
| Rocky Mountain | ||||||||||||
| Colorado | 173,304 | 176,003 | 177,845 | 183,180 | 183,039 | 185,216 | 1.6 | 1.0 | 3.0 | -0.1 | 1.2 | 44 |
| Idaho | 40,127 | 40,912 | 41,608 | 42,908 | 43,729 | 44,231 | 2.0 | 1.7 | 3.1 | 1.9 | 1.1 | 45 |
| Montana | 26,718 | 27,321 | 27,669 | 28,290 | 28,464 | 28,894 | 2.3 | 1.3 | 2.2 | 0.6 | 1.5 | 15 |
| Utah | 66,999 | 68,592 | 70,073 | 71,901 | 72,995 | 74,373 | 2.4 | 2.2 | 2.6 | 1.5 | 1.9 | 3 |
| Wyoming | 18,745 | 19,183 | 19,530 | 20,098 | 20,713 | 21,102 | 2.3 | 1.8 | 2.9 | 3.1 | 1.9 | 4 |
| Far West | ||||||||||||
| Alaska | 23,351 | 23,643 | 23,923 | 24,351 | 24,873 | 25,230 | 1.3 | 1.2 | 1.8 | 2.1 | 1.4 | 19 |
| California | 1,319,130 | 1,344,613 | 1,365,352 | 1,399,380 | 1,406,240 | 1,423,592 | 1.9 | 1.5 | 2.5 | 0.5 | 1.2 | 40 |
| Hawaii | 43,607 | 44,194 | 44,880 | 45,633 | 46,123 | 46,900 | 1.3 | 1.6 | 1.7 | 1.1 | 1.7 | 9 |
| Nevada | 86,362 | 86,855 | 88,202 | 90,537 | 92,150 | 93,853 | 0.6 | 1.6 | 2.6 | 1.8 | 1.8 | 6 |
| Oregon | 116,053 | 118,325 | 119,627 | 122,138 | 123,084 | 124,811 | 2.0 | 1.1 | 2.1 | 0.8 | 1.4 | 22 |
| Washington | 219,257 | 224,017 | 226,692 | 232,315 | 234,678 | 240,709 | 2.2 | 1.2 | 2.5 | 1.0 | 2.6 | 1 |
| BEA Regions | ||||||||||||
| New England | 589,641 | 599,190 | 606,385 | 619,086 | 623,130 | 630,191 | 1.6 | 1.2 | 2.1 | 0.7 | 1.1 | -- |
| Mideast | 1,864,467 | 1,896,216 | 1,924,070 | 1,970,116 | 1,979,415 | 2,004,365 | 1.7 | 1.5 | 2.4 | 0.5 | 1.3 | -- |
| Great Lakes | 1,529,929 | 1,547,714 | 1,564,552 | 1,593,201 | 1,605,809 | 1,627,533 | 1.2 | 1.1 | 1.8 | 0.8 | 1.4 | -- |
| Plains | 655,750 | 664,791 | 673,357 | 686,313 | 693,004 | 702,580 | 1.4 | 1.3 | 1.9 | 1.0 | 1.4 | -- |
| Southeast | 2,302,275 | 2,272,542 | 2,379,509 | 2,423,762 | 2,448,199 | 2,482,937 | -1.3 | 4.7 | 1.9 | 1.0 | 1.4 | -- |
| Southwest | 1,071,251 | 1,094,349 | 1,116,324 | 1,147,681 | 1,162,534 | 1,181,565 | 2.2 | 2.0 | 2.8 | 1.3 | 1.6 | -- |
| Rocky Mountain | 325,893 | 332,011 | 336,726 | 346,376 | 348,939 | 353,816 | 1.9 | 1.4 | 2.9 | 0.7 | 1.4 | -- |
| Far West | 1,807,760 | 1,841,647 | 1,868,676 | 1,914,354 | 1,927,148 | 1,955,097 | 1.9 | 1.5 | 2.4 | 0.7 | 1.5 | -- |
| [Seasonally adjusted] | ||||||||||||
| Percent change/2 | Percent change in personal income |
Contribution to percent change in personal income |
Dollar change (millions) | |||||||||
| Personal income |
Net earnings/1 |
Dividends, interest, and rent |
Transfer receipts |
(percentage points) | Personal income |
Net earnings/1 |
Dividends, interest, and rent |
Transfer receipts |
||||
| Net earnings/1 |
Dividends, interest, and rent |
Transfer receipts |
||||||||||
| 1. Net earnings is earnings by place of work--the sum of wage and salary disbursements, supplements to wages and salaries, and proprietors' income--less contributions for government social insurance plus an adjustment to convert earnings by place of work to a place-of-residence basis. | ||||||||||||
| 2. Percent changes are expressed at quarterly rates. | ||||||||||||
| Note: Estimates may not add to totals because of rounding. | Source: U.S. Bureau of Economic Analysis | |||||||||||
| United States | 1.4 | 1.1 | 2.3 | 1.8 | 1.4 | 0.76 | 0.36 | 0.27 | 149,905 | 81,484 | 39,358 | 29,063 |
| New England | ||||||||||||
| Connecticut | 1.0 | 0.7 | 2.1 | 1.6 | 1.0 | 0.48 | 0.33 | 0.18 | 1,724 | 829 | 581 | 314 |
| Maine | 1.3 | 0.8 | 2.3 | 2.2 | 1.3 | 0.55 | 0.32 | 0.43 | 559 | 235 | 138 | 186 |
| Massachusetts | 1.2 | 0.8 | 2.2 | 2.0 | 1.2 | 0.58 | 0.36 | 0.28 | 3,598 | 1,711 | 1,056 | 831 |
| New Hampshire | 1.0 | 0.7 | 1.8 | 1.8 | 1.0 | 0.48 | 0.26 | 0.22 | 497 | 250 | 135 | 112 |
| Rhode Island | 1.0 | 0.5 | 2.4 | 1.7 | 1.0 | 0.34 | 0.39 | 0.31 | 416 | 136 | 156 | 124 |
| Vermont | 1.3 | 1.0 | 2.0 | 1.8 | 1.3 | 0.66 | 0.30 | 0.31 | 267 | 138 | 64 | 65 |
| Mideast | ||||||||||||
| Delaware | 1.4 | 0.9 | 2.5 | 2.2 | 1.4 | 0.65 | 0.42 | 0.31 | 453 | 214 | 137 | 101 |
| District of Columbia | 1.1 | 0.8 | 2.0 | 1.6 | 1.1 | 0.63 | 0.27 | 0.20 | 356 | 205 | 88 | 64 |
| Maryland | 1.4 | 1.1 | 2.2 | 2.0 | 1.4 | 0.78 | 0.37 | 0.22 | 3,360 | 1,912 | 901 | 546 |
| New Jersey | 1.3 | 0.8 | 2.7 | 2.0 | 1.3 | 0.59 | 0.42 | 0.24 | 5,071 | 2,401 | 1,710 | 960 |
| New York | 1.2 | 0.9 | 2.2 | 1.7 | 1.2 | 0.59 | 0.34 | 0.29 | 9,939 | 4,802 | 2,757 | 2,380 |
| Pennsylvania | 1.3 | 0.9 | 2.1 | 1.8 | 1.3 | 0.63 | 0.32 | 0.32 | 5,771 | 2,857 | 1,464 | 1,450 |
| Great Lakes | ||||||||||||
| Illinois | 1.4 | 1.0 | 2.4 | 1.7 | 1.4 | 0.73 | 0.40 | 0.23 | 6,656 | 3,558 | 1,974 | 1,123 |
| Indiana | 1.3 | 1.0 | 2.4 | 1.9 | 1.3 | 0.69 | 0.36 | 0.29 | 2,725 | 1,409 | 727 | 589 |
| Michigan | 1.5 | 1.2 | 2.4 | 1.7 | 1.5 | 0.82 | 0.38 | 0.27 | 4,987 | 2,777 | 1,284 | 926 |
| Ohio | 1.3 | 1.0 | 2.3 | 1.7 | 1.3 | 0.67 | 0.33 | 0.29 | 4,933 | 2,561 | 1,252 | 1,120 |
| Wisconsin | 1.3 | 0.9 | 2.5 | 1.7 | 1.3 | 0.60 | 0.43 | 0.24 | 2,424 | 1,143 | 817 | 464 |
| Plains | ||||||||||||
| Iowa | 1.4 | 1.1 | 2.4 | 1.7 | 1.4 | 0.76 | 0.41 | 0.25 | 1,412 | 758 | 404 | 250 |
| Kansas | 1.6 | 1.3 | 2.6 | 1.7 | 1.6 | 0.92 | 0.43 | 0.24 | 1,515 | 877 | 407 | 231 |
| Minnesota | 1.2 | 0.9 | 1.9 | 2.0 | 1.2 | 0.61 | 0.34 | 0.25 | 2,375 | 1,212 | 673 | 490 |
| Missouri | 1.4 | 1.0 | 2.4 | 1.8 | 1.4 | 0.68 | 0.40 | 0.31 | 2,659 | 1,304 | 760 | 595 |
| Nebraska | 1.5 | 1.1 | 2.6 | 1.6 | 1.5 | 0.76 | 0.48 | 0.22 | 887 | 461 | 294 | 133 |
| North Dakota | 1.1 | 0.8 | 2.2 | 1.3 | 1.1 | 0.58 | 0.35 | 0.21 | 236 | 120 | 73 | 42 |
| South Dakota | 1.9 | 1.5 | 2.8 | 1.7 | 1.9 | 0.98 | 0.64 | 0.24 | 493 | 258 | 170 | 64 |
| Southeast | ||||||||||||
| Alabama | 1.4 | 0.9 | 2.9 | 1.8 | 1.4 | 0.61 | 0.47 | 0.33 | 2,012 | 875 | 670 | 467 |
| Arkansas | 1.6 | 1.2 | 2.7 | 2.0 | 1.6 | 0.77 | 0.41 | 0.42 | 1,250 | 601 | 319 | 330 |
| Florida | 1.6 | 1.2 | 2.3 | 2.1 | 1.6 | 0.70 | 0.56 | 0.33 | 10,251 | 4,517 | 3,610 | 2,124 |
| Georgia | 1.3 | 0.9 | 2.4 | 2.1 | 1.3 | 0.67 | 0.34 | 0.28 | 3,867 | 2,006 | 1,021 | 840 |
| Kentucky | 1.4 | 1.0 | 2.4 | 1.9 | 1.4 | 0.69 | 0.34 | 0.37 | 1,720 | 846 | 416 | 458 |
| Louisiana | 1.7 | 2.1 | 2.5 | 0.0 | 1.7 | 1.37 | 0.33 | 0.00 | 2,249 | 1,811 | 437 | 1 |
| Mississippi | 1.4 | 1.3 | 2.6 | 0.8 | 1.4 | 0.87 | 0.30 | 0.18 | 1,040 | 670 | 232 | 138 |
| North Carolina | 1.4 | 1.0 | 2.2 | 2.2 | 1.4 | 0.67 | 0.35 | 0.35 | 3,881 | 1,898 | 993 | 991 |
| South Carolina | 1.4 | 0.9 | 2.5 | 2.2 | 1.4 | 0.62 | 0.36 | 0.41 | 1,752 | 783 | 453 | 516 |
| Tennessee | 1.1 | 0.7 | 2.5 | 1.9 | 1.1 | 0.49 | 0.30 | 0.34 | 2,190 | 951 | 583 | 656 |
| Virginia | 1.3 | 1.0 | 1.9 | 2.0 | 1.3 | 0.76 | 0.28 | 0.22 | 3,759 | 2,267 | 829 | 664 |
| West Virginia | 1.5 | 1.3 | 2.2 | 1.7 | 1.5 | 0.80 | 0.29 | 0.46 | 767 | 398 | 142 | 226 |
| Southwest | ||||||||||||
| Arizona | 1.8 | 1.6 | 2.1 | 2.5 | 1.8 | 1.07 | 0.33 | 0.38 | 3,440 | 2,063 | 643 | 734 |
| New Mexico | 2.1 | 1.8 | 3.0 | 2.2 | 2.1 | 1.22 | 0.46 | 0.40 | 1,197 | 702 | 265 | 229 |
| Oklahoma | 1.5 | 1.1 | 2.7 | 1.9 | 1.5 | 0.74 | 0.42 | 0.32 | 1,683 | 846 | 475 | 362 |
| Texas | 1.6 | 1.4 | 2.3 | 2.0 | 1.6 | 1.05 | 0.28 | 0.26 | 12,711 | 8,420 | 2,233 | 2,058 |
| Rocky Mountain | ||||||||||||
| Colorado | 1.2 | 0.9 | 2.0 | 2.0 | 1.2 | 0.68 | 0.31 | 0.20 | 2,177 | 1,250 | 564 | 363 |
| Idaho | 1.1 | 0.6 | 2.6 | 2.0 | 1.1 | 0.40 | 0.46 | 0.29 | 502 | 173 | 201 | 129 |
| Montana | 1.5 | 1.2 | 2.2 | 1.8 | 1.5 | 0.78 | 0.43 | 0.30 | 430 | 223 | 122 | 86 |
| Utah | 1.9 | 1.8 | 2.1 | 2.0 | 1.9 | 1.38 | 0.28 | 0.23 | 1,379 | 1,005 | 207 | 167 |
| Wyoming | 1.9 | 1.7 | 2.3 | 1.9 | 1.9 | 1.12 | 0.52 | 0.23 | 389 | 232 | 108 | 48 |
| Far West | ||||||||||||
| Alaska | 1.4 | 1.3 | 1.6 | 1.9 | 1.4 | 0.94 | 0.21 | 0.29 | 357 | 233 | 52 | 73 |
| California | 1.2 | 0.9 | 2.1 | 1.7 | 1.2 | 0.67 | 0.35 | 0.22 | 17,352 | 9,383 | 4,897 | 3,072 |
| Hawaii | 1.7 | 1.5 | 2.5 | 1.9 | 1.7 | 1.06 | 0.39 | 0.24 | 777 | 488 | 179 | 110 |
| Nevada | 1.8 | 1.7 | 2.1 | 2.4 | 1.8 | 1.18 | 0.41 | 0.26 | 1,703 | 1,088 | 379 | 236 |
| Oregon | 1.4 | 1.1 | 2.1 | 1.8 | 1.4 | 0.77 | 0.38 | 0.26 | 1,728 | 944 | 463 | 321 |
| Washington | 2.6 | 2.8 | 2.2 | 1.6 | 2.6 | 2.00 | 0.36 | 0.21 | 6,031 | 4,683 | 845 | 504 |
| BEA Regions | ||||||||||||
| New England | 1.1 | 0.8 | 2.2 | 1.9 | 1.1 | 0.53 | 0.34 | 0.26 | 7,061 | 3,300 | 2,130 | 1,631 |
| Mideast | 1.3 | 0.9 | 2.3 | 1.8 | 1.3 | 0.63 | 0.36 | 0.28 | 24,949 | 12,391 | 7,056 | 5,502 |
| Great Lakes | 1.4 | 1.0 | 2.4 | 1.7 | 1.4 | 0.71 | 0.38 | 0.26 | 21,724 | 11,448 | 6,054 | 4,222 |
| Plains | 1.4 | 1.1 | 2.3 | 1.8 | 1.4 | 0.72 | 0.40 | 0.26 | 9,576 | 4,990 | 2,781 | 1,806 |
| Southeast | 1.4 | 1.1 | 2.4 | 1.8 | 1.4 | 0.72 | 0.40 | 0.30 | 34,738 | 17,623 | 9,704 | 7,411 |
| Southwest | 1.6 | 1.4 | 2.3 | 2.1 | 1.6 | 1.03 | 0.31 | 0.29 | 19,031 | 12,032 | 3,616 | 3,383 |
| Rocky Mountain | 1.4 | 1.1 | 2.1 | 2.0 | 1.4 | 0.83 | 0.34 | 0.23 | 4,877 | 2,883 | 1,202 | 792 |
| Far West | 1.5 | 1.2 | 2.1 | 1.7 | 1.5 | 0.87 | 0.35 | 0.22 | 27,948 | 16,818 | 6,815 | 4,315 |
| [Percentage points, seasonally adjusted] | |||||||||||||
| Total Earnings/1 |
Farm | Forestry, fishing, related activities and other/2 |
Mining | Utilities | Con- struction |
Manufacturing | Wholesale trade |
Retail trade |
Transpor- tation and warehousing |
Information | Finance and insurance |
||
| Durable goods |
Nondurable goods |
||||||||||||
| 1. Earnings by place of work is the sum of wage and salary disbursements (payrolls), supplements to wages and salaries, and proprietors' income. | |||||||||||||
| 2. "Other" consists of the wage and salary disbursements to U.S. residents employed by international organizations and foreign embassies and consulates in the U.S. | |||||||||||||
| 3. Data are suppressed to avoid disclosure of confidential information. | |||||||||||||
| 4. Not meaningful. | Source: U.S. Bureau of Economic Analysis | ||||||||||||
| United States | 1.1 | 0.03 | - 0.01 | 0.05 | 0.01 | 0.00 | 0.03 | - 0.01 | 0.09 | 0.02 | 0.09 | 0.10 | - 0.02 |
| New England | |||||||||||||
| Connecticut | 0.6 | 0.00 | 0.00 | 0.01 | 0.01 | - 0.09 | 0.04 | - 0.01 | 0.10 | 0.01 | 0.05 | 0.02 | - 0.07 |
| Maine | 0.8 | 0.03 | - 0.03 | 0.00 | 0.01 | - 0.04 | 0.00 | - 0.06 | 0.07 | 0.02 | 0.07 | 0.03 | 0.00 |
| Massachusetts | 0.8 | 0.00 | - 0.01 | 0.01 | 0.01 | - 0.04 | 0.02 | 0.00 | 0.09 | 0.01 | 0.04 | 0.03 | - 0.03 |
| New Hampshire | 0.6 | 0.00 | - 0.01 | 0.01 | 0.01 | - 0.10 | - 0.01 | - 0.02 | 0.10 | 0.07 | 0.03 | 0.02 | - 0.02 |
| Rhode Island | 0.4 | 0.00 | - 0.01 | 0.00 | 0.01 | - 0.02 | 0.01 | - 0.01 | 0.06 | 0.01 | 0.04 | 0.01 | 0.02 |
| Vermont | 1.0 | 0.05 | - 0.01 | 0.01 | 0.01 | - 0.04 | 0.01 | - 0.01 | 0.08 | 0.02 | 0.06 | 0.01 | - 0.01 |
| Mideast | |||||||||||||
| Delaware | 0.9 | 0.10 | 0.00 | --/3 | 0.01 | --/3 | 0.19 | 0.00 | - 0.26 | 0.02 | 0.06 | 0.02 | - 0.03 |
| District of Columbia | 0.6 | 0.00 | - 0.05 | --/3 | 0.00 | --/3 | 0.00 | 0.00 | 0.01 | 0.01 | 0.01 | 0.08 | - 0.02 |
| Maryland | 1.1 | 0.01 | 0.00 | 0.00 | 0.02 | 0.00 | 0.02 | - 0.01 | 0.07 | 0.01 | 0.06 | 0.02 | - 0.02 |
| New Jersey | 0.8 | 0.00 | 0.00 | 0.00 | 0.01 | - 0.03 | - 0.02 | - 0.04 | 0.10 | 0.03 | 0.09 | 0.03 | - 0.05 |
| New York | 0.9 | 0.01 | - 0.01 | 0.01 | 0.00 | - 0.01 | 0.01 | - 0.04 | 0.04 | 0.00 | 0.08 | 0.05 | 0.00 |
| Pennsylvania | 0.9 | 0.02 | 0.00 | 0.02 | 0.01 | - 0.02 | 0.01 | - 0.02 | 0.09 | 0.02 | 0.11 | 0.03 | - 0.02 |
| Great Lakes | |||||||||||||
| Illinois | 1.0 | 0.00 | 0.00 | 0.04 | 0.01 | 0.00 | 0.02 | - 0.01 | 0.13 | 0.03 | 0.12 | 0.02 | - 0.02 |
| Indiana | 1.0 | 0.01 | 0.00 | 0.02 | 0.01 | - 0.04 | 0.24 | 0.00 | 0.09 | 0.02 | 0.11 | 0.01 | - 0.01 |
| Michigan | 1.2 | 0.01 | 0.00 | 0.01 | 0.01 | - 0.04 | 0.47 | 0.02 | 0.07 | - 0.02 | 0.08 | 0.01 | - 0.03 |
| Ohio | 1.0 | 0.01 | 0.00 | 0.01 | 0.01 | - 0.03 | 0.16 | 0.00 | 0.09 | 0.00 | 0.09 | 0.01 | - 0.03 |
| Wisconsin | 0.8 | 0.05 | - 0.01 | 0.01 | 0.01 | - 0.04 | 0.09 | 0.01 | 0.10 | 0.00 | 0.13 | 0.01 | - 0.03 |
| Plains | |||||||||||||
| Iowa | 1.1 | 0.17 | - 0.01 | 0.01 | 0.01 | 0.01 | 0.10 | 0.02 | 0.05 | 0.02 | 0.11 | 0.01 | 0.00 |
| Kansas | 1.3 | 0.21 | - 0.01 | 0.08 | 0.01 | - 0.06 | 0.14 | 0.00 | 0.10 | 0.01 | 0.06 | 0.01 | - 0.01 |
| Minnesota | 0.9 | 0.04 | 0.00 | 0.01 | 0.01 | - 0.02 | 0.04 | - 0.01 | 0.13 | 0.02 | 0.09 | 0.02 | - 0.04 |
| Missouri | 1.0 | 0.03 | - 0.01 | 0.02 | 0.01 | - 0.01 | 0.05 | - 0.01 | 0.10 | 0.02 | 0.10 | 0.03 | - 0.02 |
| Nebraska | 1.1 | 0.32 | - 0.01 | 0.02 | 0.02 | - 0.05 | - 0.13 | - 0.01 | 0.08 | 0.01 | 0.13 | - 0.02 | 0.02 |
| North Dakota | 0.9 | - 0.06 | - 0.01 | 0.10 | 0.02 | - 0.10 | - 0.02 | 0.02 | 0.14 | 0.05 | 0.09 | 0.05 | 0.01 |
| South Dakota | 1.5 | 0.39 | - 0.01 | 0.01 | 0.02 | - 0.04 | 0.07 | 0.02 | 0.15 | 0.15 | 0.16 | 0.03 | 0.01 |
| Southeast | |||||||||||||
| Alabama | 0.9 | 0.07 | - 0.02 | 0.04 | 0.01 | - 0.06 | 0.03 | - 0.04 | 0.08 | 0.02 | 0.08 | 0.01 | - 0.02 |
| Arkansas | 1.2 | 0.15 | - 0.02 | 0.04 | 0.01 | - 0.01 | 0.01 | - 0.02 | 0.09 | 0.03 | 0.15 | 0.04 | - 0.01 |
| Florida | 1.2 | 0.02 | - 0.01 | 0.01 | 0.01 | 0.01 | 0.01 | 0.00 | 0.12 | 0.02 | 0.09 | 0.02 | - 0.01 |
| Georgia | 0.9 | 0.04 | - 0.01 | 0.01 | 0.01 | - 0.02 | 0.04 | 0.01 | 0.10 | 0.03 | 0.12 | 0.04 | - 0.02 |
| Kentucky | 1.0 | 0.05 | - 0.01 | 0.08 | 0.01 | - 0.02 | - 0.04 | - 0.01 | 0.08 | 0.01 | 0.15 | 0.02 | - 0.01 |
| Louisiana | 2.1 | 0.01 | - 0.01 | 0.21 | 0.01 | 0.26 | 0.19 | 0.01 | 0.11 | 0.08 | 0.21 | 0.04 | 0.01 |
| Mississippi | 1.3 | 0.10 | - 0.02 | 0.05 | 0.02 | 0.02 | 0.10 | - 0.04 | 0.07 | 0.00 | 0.13 | 0.00 | - 0.01 |
| North Carolina | 1.0 | 0.06 | - 0.01 | 0.01 | 0.01 | 0.00 | 0.02 | - 0.02 | 0.10 | 0.03 | 0.09 | 0.03 | 0.00 |
| South Carolina | 0.9 | 0.02 | - 0.01 | 0.00 | 0.02 | 0.03 | - 0.01 | - 0.03 | 0.07 | 0.01 | 0.09 | 0.02 | - 0.01 |
| Tennessee | 0.7 | --/4 | 0.00 | 0.01 | 0.00 | - 0.04 | 0.11 | - 0.01 | 0.10 | 0.03 | 0.17 | 0.02 | - 0.02 |
| Virginia | 1.1 | --/4 | 0.00 | 0.02 | 0.01 | - 0.02 | 0.00 | - 0.01 | 0.08 | - 0.01 | 0.05 | 0.02 | - 0.02 |
| West Virginia | 1.3 | --/4 | - 0.01 | 0.21 | 0.02 | 0.04 | 0.06 | - 0.01 | 0.12 | 0.05 | 0.09 | 0.03 | - 0.05 |
| Southwest | |||||||||||||
| Arizona | 1.6 | 0.03 | - 0.01 | 0.03 | 0.00 | 0.15 | 0.01 | 0.00 | 0.13 | 0.10 | 0.09 | 0.03 | 0.01 |
| New Mexico | 1.8 | 0.19 | - 0.01 | 0.17 | 0.01 | 0.14 | 0.03 | 0.00 | 0.07 | 0.07 | 0.07 | 0.05 | - 0.01 |
| Oklahoma | 1.0 | 0.09 | - 0.01 | 0.39 | 0.02 | - 0.08 | - 0.02 | 0.00 | 0.09 | 0.02 | - 0.05 | 0.00 | - 0.02 |
| Texas | 1.4 | 0.04 | - 0.01 | 0.28 | 0.01 | 0.13 | 0.07 | 0.00 | 0.11 | 0.03 | 0.07 | 0.03 | - 0.03 |
| Rocky Mountain | |||||||||||||
| Colorado | 0.9 | 0.05 | 0.00 | 0.12 | 0.01 | - 0.14 | 0.03 | 0.02 | 0.07 | 0.00 | 0.07 | 0.07 | - 0.04 |
| Idaho | 0.5 | 0.23 | - 0.04 | - 0.06 | 0.01 | 0.01 | 0.03 | 0.02 | 0.09 | - 0.24 | 0.09 | 0.02 | - 0.01 |
| Montana | 1.2 | 0.04 | - 0.02 | 0.14 | 0.01 | 0.05 | 0.02 | 0.01 | 0.08 | 0.05 | 0.10 | 0.03 | 0.01 |
| Utah | 1.8 | 0.04 | 0.00 | 0.07 | 0.01 | 0.19 | 0.09 | 0.05 | 0.07 | 0.14 | 0.08 | 0.08 | 0.05 |
| Wyoming | 1.7 | 0.10 | - 0.01 | 0.69 | 0.01 | 0.19 | 0.02 | 0.04 | 0.11 | 0.07 | 0.10 | 0.00 | 0.00 |
| Far West | |||||||||||||
| Alaska | 1.3 | 0.00 | - 0.02 | 0.27 | 0.00 | - 0.07 | 0.00 | - 0.01 | 0.01 | - 0.02 | 0.24 | 0.03 | 0.01 |
| California | 0.9 | 0.04 | - 0.02 | 0.01 | 0.01 | - 0.05 | 0.01 | 0.01 | 0.09 | 0.03 | 0.08 | 0.06 | - 0.03 |
| Hawaii | 1.5 | 0.02 | 0.00 | 0.00 | 0.01 | 0.00 | 0.00 | 0.00 | 0.03 | 0.00 | 0.17 | - 0.02 | 0.02 |
| Nevada | 1.7 | 0.01 | 0.00 | 0.06 | 0.00 | 0.21 | 0.05 | 0.00 | 0.09 | 0.07 | 0.12 | 0.01 | - 0.05 |
| Oregon | 1.1 | 0.04 | - 0.04 | 0.01 | 0.00 | - 0.04 | 0.07 | - 0.06 | 0.12 | 0.04 | 0.11 | 0.00 | 0.02 |
| Washington | 2.9 | 0.03 | - 0.03 | 0.01 | 0.00 | 0.05 | - 0.85 | 0.01 | 0.06 | 0.02 | 0.08 | 2.91 | - 0.06 |
| BEA Regions | |||||||||||||
| New England | 0.7 | 0.01 | - 0.01 | 0.01 | 0.01 | - 0.06 | 0.02 | - 0.01 | 0.09 | 0.02 | 0.05 | 0.03 | - 0.03 |
| Mideast | 0.9 | 0.01 | - 0.01 | 0.01 | 0.01 | - 0.02 | 0.01 | - 0.03 | 0.06 | 0.01 | 0.08 | 0.04 | - 0.02 |
| Great Lakes | 1.0 | 0.01 | 0.00 | 0.02 | 0.01 | - 0.02 | 0.18 | 0.00 | 0.10 | 0.01 | 0.11 | 0.02 | - 0.02 |
| Plains | 1.0 | 0.11 | - 0.01 | 0.03 | 0.01 | - 0.02 | 0.05 | 0.00 | 0.10 | 0.03 | 0.10 | 0.02 | - 0.02 |
| Southeast | 1.1 | 0.04 | - 0.01 | 0.03 | 0.01 | 0.01 | 0.03 | - 0.01 | 0.10 | 0.02 | 0.11 | 0.02 | - 0.01 |
| Southwest | 1.4 | 0.05 | - 0.01 | 0.24 | 0.01 | 0.11 | 0.05 | 0.00 | 0.11 | 0.04 | 0.06 | 0.03 | - 0.02 |
| Rocky Mountain | 1.1 | 0.07 | - 0.01 | 0.12 | 0.01 | - 0.02 | 0.04 | 0.02 | 0.08 | 0.01 | 0.08 | 0.06 | - 0.01 |
| Far West | 1.2 | 0.04 | - 0.02 | 0.02 | 0.01 | - 0.03 | - 0.09 | 0.00 | 0.09 | 0.03 | 0.09 | 0.40 | - 0.03 |
| [Percentage points, seasonally adjusted] | ||||||||||||
| Real estate and rental and leasing |
Professional and technical services |
Manage- ment of companies and enterprises |
Adminis- trative and waste services |
Educational services |
Health care and social assistance |
Arts, entertain- ment, and recreation |
Accomo- dation and food services |
Other services, except public administration |
Government | |||
| Federal, civilian |
Military | State and local |
||||||||||
| Source: U.S. Bureau of Economic Analysis | ||||||||||||
| United States | - 0.03 | 0.20 | 0.03 | 0.05 | 0.02 | 0.12 | 0.01 | 0.05 | 0.02 | 0.02 | 0.02 | 0.19 |
| New England | ||||||||||||
| Connecticut | - 0.03 | 0.18 | 0.04 | 0.03 | 0.03 | 0.13 | 0.00 | 0.04 | 0.02 | 0.00 | - 0.03 | 0.14 |
| Maine | - 0.03 | 0.11 | 0.03 | 0.04 | 0.02 | 0.19 | 0.01 | 0.07 | 0.02 | 0.05 | 0.06 | 0.19 |
| Massachusetts | - 0.03 | 0.28 | 0.05 | 0.04 | 0.04 | 0.15 | 0.01 | 0.05 | 0.02 | - 0.04 | 0.00 | 0.13 |
| New Hampshire | - 0.05 | 0.14 | 0.04 | 0.03 | 0.01 | 0.14 | 0.02 | 0.03 | 0.03 | 0.04 | 0.00 | 0.09 |
| Rhode Island | - 0.01 | 0.12 | - 0.28 | 0.03 | 0.05 | 0.17 | 0.00 | 0.07 | 0.02 | 0.01 | - 0.09 | 0.19 |
| Vermont | - 0.02 | 0.14 | 0.00 | 0.03 | 0.03 | 0.17 | 0.01 | 0.08 | 0.03 | 0.05 | 0.03 | 0.22 |
| Mideast | ||||||||||||
| Delaware | 0.00 | 0.22 | 0.08 | 0.04 | 0.01 | 0.13 | 0.01 | 0.05 | 0.02 | 0.02 | 0.00 | 0.16 |
| District of Columbia | 0.00 | 0.30 | - 0.18 | - 0.09 | 0.01 | 0.07 | - 0.01 | 0.04 | 0.03 | 0.34 | 0.00 | 0.09 |
| Maryland | - 0.02 | 0.26 | 0.02 | 0.05 | 0.03 | 0.13 | 0.01 | 0.05 | 0.02 | 0.12 | 0.07 | 0.21 |
| New Jersey | - 0.03 | 0.21 | 0.07 | 0.05 | 0.01 | 0.11 | 0.01 | 0.04 | 0.02 | 0.03 | 0.01 | 0.16 |
| New York | - 0.01 | 0.30 | 0.01 | 0.03 | 0.05 | 0.12 | 0.00 | 0.05 | 0.02 | 0.01 | 0.01 | 0.12 |
| Pennsylvania | - 0.03 | 0.18 | 0.05 | 0.04 | 0.05 | 0.17 | 0.01 | 0.04 | 0.02 | - 0.01 | 0.01 | 0.15 |
| Great Lakes | ||||||||||||
| Illinois | - 0.03 | 0.21 | 0.06 | 0.05 | 0.03 | 0.11 | 0.01 | 0.05 | 0.02 | 0.02 | - 0.04 | 0.21 |
| Indiana | - 0.03 | 0.10 | 0.03 | 0.03 | 0.01 | 0.13 | 0.01 | 0.04 | 0.02 | 0.02 | 0.00 | 0.15 |
| Michigan | - 0.08 | 0.22 | 0.04 | 0.08 | 0.01 | 0.13 | 0.01 | 0.04 | 0.02 | 0.02 | 0.01 | 0.10 |
| Ohio | - 0.02 | 0.14 | 0.06 | 0.02 | 0.02 | 0.13 | 0.01 | 0.04 | 0.02 | 0.02 | 0.00 | 0.21 |
| Wisconsin | - 0.02 | 0.12 | 0.06 | 0.04 | - 0.01 | 0.19 | - 0.06 | 0.04 | 0.03 | 0.03 | 0.01 | 0.07 |
| Plains | ||||||||||||
| Iowa | - 0.01 | 0.08 | 0.02 | 0.06 | 0.03 | 0.13 | 0.01 | 0.03 | 0.01 | 0.03 | - 0.01 | 0.24 |
| Kansas | - 0.03 | 0.14 | 0.02 | 0.03 | 0.01 | 0.10 | 0.00 | 0.04 | 0.01 | 0.00 | 0.09 | 0.30 |
| Minnesota | - 0.09 | 0.17 | - 0.06 | 0.04 | 0.02 | 0.17 | 0.02 | 0.04 | 0.03 | 0.03 | 0.02 | 0.17 |
| Missouri | - 0.02 | 0.15 | 0.08 | 0.04 | 0.02 | 0.13 | 0.02 | 0.05 | 0.03 | - 0.08 | 0.07 | 0.19 |
| Nebraska | - 0.01 | 0.15 | 0.03 | 0.03 | 0.02 | 0.15 | 0.00 | 0.03 | 0.02 | 0.05 | 0.00 | 0.22 |
| North Dakota | - 0.01 | 0.07 | 0.02 | 0.03 | 0.01 | 0.19 | 0.00 | 0.05 | 0.03 | 0.03 | 0.00 | 0.17 |
| South Dakota | - 0.07 | 0.06 | 0.02 | 0.04 | 0.03 | 0.14 | 0.01 | 0.04 | 0.05 | 0.03 | 0.05 | 0.14 |
| Southeast | ||||||||||||
| Alabama | - 0.02 | 0.14 | 0.01 | 0.03 | 0.01 | 0.13 | 0.01 | 0.04 | 0.03 | 0.05 | 0.04 | 0.23 |
| Arkansas | - 0.02 | 0.11 | 0.08 | 0.04 | 0.01 | 0.14 | 0.01 | 0.05 | 0.03 | 0.01 | 0.03 | 0.21 |
| Florida | - 0.03 | 0.20 | 0.04 | 0.08 | 0.01 | 0.15 | 0.03 | 0.10 | 0.04 | 0.02 | 0.02 | 0.21 |
| Georgia | - 0.02 | 0.16 | 0.04 | 0.06 | 0.01 | 0.12 | 0.01 | 0.06 | 0.02 | - 0.04 | - 0.02 | 0.18 |
| Kentucky | - 0.01 | 0.11 | 0.04 | 0.03 | 0.01 | 0.14 | 0.01 | 0.05 | 0.02 | 0.01 | 0.07 | 0.22 |
| Louisiana | - 0.04 | 0.31 | 0.03 | 0.12 | 0.03 | 0.21 | 0.02 | 0.09 | 0.07 | 0.02 | 0.00 | 0.12 |
| Mississippi | - 0.03 | 0.12 | 0.01 | 0.03 | 0.00 | 0.13 | 0.02 | 0.10 | 0.03 | 0.09 | 0.04 | 0.37 |
| North Carolina | - 0.03 | 0.13 | 0.06 | 0.05 | 0.02 | 0.12 | 0.01 | 0.05 | 0.03 | 0.02 | 0.03 | 0.19 |
| South Carolina | - 0.02 | 0.14 | 0.02 | 0.05 | 0.01 | 0.09 | 0.02 | 0.07 | 0.01 | 0.03 | 0.02 | 0.27 |
| Tennessee | - 0.04 | 0.13 | - 0.07 | 0.06 | 0.02 | - 0.08 | 0.02 | 0.06 | 0.03 | - 0.02 | 0.03 | 0.17 |
| Virginia | - 0.03 | 0.30 | 0.08 | 0.06 | 0.01 | 0.10 | 0.01 | 0.05 | 0.02 | 0.07 | 0.05 | 0.20 |
| West Virginia | - 0.01 | 0.14 | 0.01 | 0.01 | 0.01 | 0.14 | 0.01 | 0.08 | 0.03 | 0.07 | 0.04 | 0.21 |
| Southwest | ||||||||||||
| Arizona | - 0.06 | 0.17 | 0.03 | 0.13 | 0.02 | 0.15 | 0.03 | 0.09 | 0.04 | 0.05 | 0.02 | 0.31 |
| New Mexico | - 0.01 | 0.21 | 0.02 | 0.11 | 0.01 | 0.19 | 0.01 | 0.10 | 0.02 | 0.06 | 0.06 | 0.26 |
| Oklahoma | - 0.10 | 0.14 | 0.00 | - 0.03 | 0.02 | 0.08 | 0.01 | 0.00 | - 0.01 | 0.05 | 0.12 | 0.31 |
| Texas | - 0.05 | 0.22 | 0.03 | 0.04 | 0.01 | 0.08 | 0.01 | 0.04 | 0.00 | 0.01 | 0.05 | 0.22 |
| Rocky Mountain | ||||||||||||
| Colorado | - 0.08 | 0.24 | 0.05 | 0.07 | 0.02 | 0.09 | 0.02 | 0.06 | 0.01 | - 0.01 | - 0.03 | 0.21 |
| Idaho | - 0.04 | 0.18 | - 0.23 | 0.04 | 0.02 | 0.14 | 0.01 | 0.04 | 0.03 | - 0.02 | 0.02 | 0.11 |
| Montana | - 0.10 | 0.15 | 0.02 | 0.05 | 0.01 | 0.18 | 0.02 | 0.10 | 0.04 | 0.02 | 0.00 | 0.23 |
| Utah | - 0.02 | 0.27 | 0.04 | 0.05 | 0.04 | 0.10 | 0.02 | 0.06 | 0.08 | 0.06 | 0.03 | 0.23 |
| Wyoming | - 0.04 | 0.09 | - 0.11 | 0.04 | 0.01 | 0.05 | 0.02 | 0.06 | 0.04 | - 0.05 | 0.01 | 0.25 |
| Far West | ||||||||||||
| Alaska | - 0.02 | 0.15 | 0.01 | 0.05 | 0.01 | 0.13 | 0.02 | 0.07 | 0.04 | - 0.02 | 0.25 | 0.20 |
| California | - 0.05 | 0.18 | 0.02 | 0.04 | 0.02 | 0.09 | 0.02 | 0.06 | 0.03 | 0.02 | 0.02 | 0.23 |
| Hawaii | - 0.01 | 0.16 | 0.04 | 0.03 | 0.03 | 0.05 | 0.01 | 0.21 | 0.03 | 0.04 | 0.33 | 0.31 |
| Nevada | - 0.02 | 0.17 | 0.09 | 0.10 | 0.01 | 0.09 | 0.04 | 0.33 | 0.06 | 0.04 | 0.02 | 0.23 |
| Oregon | - 0.01 | 0.15 | 0.05 | 0.00 | 0.03 | 0.13 | 0.00 | 0.04 | 0.01 | - 0.01 | 0.01 | 0.40 |
| Washington | - 0.02 | 0.18 | 0.09 | 0.08 | 0.03 | 0.05 | 0.00 | - 0.04 | 0.01 | 0.06 | 0.00 | 0.21 |
| BEA Regions | ||||||||||||
| New England | - 0.03 | 0.22 | 0.02 | 0.04 | 0.04 | 0.15 | 0.01 | 0.05 | 0.02 | - 0.01 | - 0.01 | 0.14 |
| Mideast | - 0.02 | 0.25 | 0.03 | 0.03 | 0.04 | 0.13 | 0.01 | 0.05 | 0.02 | 0.03 | 0.02 | 0.14 |
| Great Lakes | - 0.04 | 0.17 | 0.05 | 0.05 | 0.02 | 0.13 | 0.00 | 0.04 | 0.02 | 0.02 | - 0.01 | 0.16 |
| Plains | - 0.04 | 0.14 | 0.01 | 0.04 | 0.02 | 0.14 | 0.01 | 0.04 | 0.02 | 0.00 | 0.04 | 0.21 |
| Southeast | - 0.03 | 0.18 | 0.03 | 0.06 | 0.01 | 0.11 | 0.02 | 0.07 | 0.03 | 0.02 | 0.02 | 0.21 |
| Southwest | - 0.05 | 0.21 | 0.03 | 0.05 | 0.01 | 0.10 | 0.02 | 0.05 | 0.01 | 0.02 | 0.05 | 0.24 |
| Rocky Mountain | - 0.06 | 0.22 | 0.00 | 0.06 | 0.02 | 0.10 | 0.02 | 0.06 | 0.03 | 0.01 | - 0.01 | 0.21 |
| Far West | - 0.04 | 0.18 | 0.04 | 0.05 | 0.02 | 0.09 | 0.02 | 0.06 | 0.03 | 0.02 | 0.03 | 0.24 |