
News Release
Advance Gross Domestic Product (GDP) by Industry
Available for this release: Full Release (PDF - ) | Charts and Tables (XLS - ), Highlights (PDF - )
Sign up for e-mail subscriptions.
| Technical: | Thomas F. Howells III: | (202) 606-9586 | BEA 07-16 | |
| Media: | Ralph Stewart: | 606-9690 |
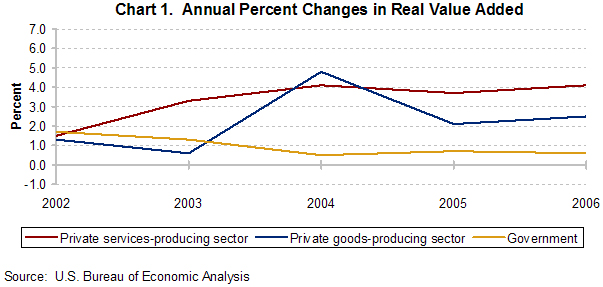
Newly available data on the industry distribution of real GDP growth show that the private services-producing sector accelerated to 4.1 percent in 2006, up from 3.7 percent in 2005, and that the private goods-producing sector accelerated to 2.5 percent, up from 2.1 percent in 2005. Real growth in government slowed slightly to 0.6 percent, down from 0.7 percent in 2005.
The private services sector’s acceleration reflected more rapid growth in “finance, insurance, real estate, rental, and leasing” that offset slower growth in retail trade, information, and “professional and business services.” Private goods-sector growth accelerated due to more rapid growth in durable-goods manufacturing and “agriculture, forestry, fishing, and hunting” and smaller decreases in mining and nondurable-goods manufacturing.
Real growth in manufacturing accelerated to 3.3 percent in 2006 after increasing 2.2 percent in 2005. This acceleration largely reflected stronger real growth in durable-goods manufacturing of 6.7 percent in 2006, up from 4.9 percent in the previous year. In 2006, durable-goods manufacturing accounted for 6.9 percent of the economy, but accounted for 13.6 percent of real GDP growth.
 |
 |
 |
 |
 |
 |
 |
 |
 |
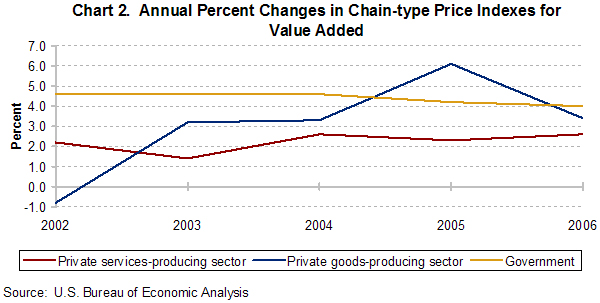
Value-added price growth for the private goods sector decelerated sharply to 3.4 percent in 2006 after increasing 6.1 percent in 2005, restraining overall GDP price growth.
The deceleration in the private goods sector’s value-added price index was largely in mining and reflected slower growth in crude petroleum prices. Despite decelerating sharply, the value-added price index for mining continued to experience double-digit growth, increasing 10.5 percent in 2006. Slower value-added price growth in construction and nondurable-goods manufacturing also contributed to the deceleration in private goods-sector price growth.
The value-added price index for the private services sector increased 2.6 percent in 2006, up from 2.3 percent in 2005. This was largely the result of faster growth in “real estate and rental and leasing” and “transportation and warehousing” that offset slower growth in wholesale trade. Value-added price growth for government slowed to 4.0 percent in 2006, down from 4.2 percent in 2005.
|
|
|
|
 |
|
|
|
|
Other highlights of the advance industry estimates for 2006 include:
- Information-communications-technology-producing industries continued their double-digit growth for the third consecutive year, increasing 12.5 percent in 2006. These industries comprised 3.9 percent of the economy, but accounted for 14.2 percent of real GDP growth.
- Within the private goods sector, construction was the only industry to experience slower growth in 2006, increasing 1.3 percent after increasing 3.9 percent the previous year.
- Relative to its size in the economy, the mining industry group was the largest contributor to growth in the GDP price index in 2006, accounting for 6.6 percent of price growth, more than three times its share of current-dollar GDP.
Additional Information:
- The advance GDP-by-industry estimates are prepared for broad industry groups based on the 1997 North American Industry Classification System and use a methodology developed for summary source data.
NOTE: These estimates rely heavily on industry data underlying the “final” 2006 fourth quarter GDP release from the national income and product accounts (NIPAs). Definitional and conceptual differences affect the comparability of some NIPA and GDP-by-industry measures. For example, in the NIPAs, the value added by goods-distribution (e.g., transport and trade) industries is included in the market value of goods. In the GDP-by-industry accounts, however, the value added by goods-distribution industries is included in the private services-producing sector. For more information, go to http://faq.bea.gov and search by keyword for “final expenditures versus value added” or see “Gross Domestic Product by Industry for 1987-2000” in the November 2004 issue of the Survey of Current Business.
BEA’s national, international, regional, and industry estimates; the Survey of Current Business; and BEA news releases are available without charge on BEA’s Web site at www.bea.gov. By visiting the site, you can also subscribe to receive free e-mail summaries of BEA releases and announcements.
* * *