
News Release
Gross Domestic Product for the Commonwealth of the Northern Mariana Islands
CAPITAL HILL, SAIPAN (June 7, 2010) – Today, the Bureau of Economic Analysis (BEA) is releasing its first set of estimates of the major components of gross domestic product (GDP) for the Commonwealth of the Northern Mariana Islands (CNMI).1
Objectively gauging changes in economic activity is difficult in the absence of comprehensive economic metrics, such as the GDP. Until now, a framework did not exist to estimate the GDP of the CNMI. The Statistical Improvement Program, funded by the Office of Insular Affairs (OIA) of the U.S. Department of the Interior, has made it possible for BEA to develop formal methodologies for measuring the GDP of the CNMI.
On May 5, 2010, BEA released estimates of total GDP for American Samoa, the CNMI, Guam, and the U.S. Virgin Islands. The estimates for the CNMI showed that from 2002 to 2007, real GDP -- GDP adjusted to remove price changes -- decreased at an average annual rate of 4.2 percent.2 (For comparison, the average annual growth rate for the United States (excluding the territories) was 2.8 percent over this period.)
The estimates released today supplement the estimates of total GDP for the CNMI that were released in May. The accompanying tables present estimates for the major components of GDP, including consumer spending, private fixed investment, net exports, and government spending.3 Also included in this release are estimates of the major components of gross domestic income.
The estimates of the major components of GDP highlight the impact that the garment manufacturing and tourism industries had on the CNMI’s economic growth over the period 2002 to 2007. The notable decreases in real GDP from 2005 to 2007 were largely driven by decreases in garment exports and in tourist expenditures in the CNMI by nonresidents. Consumer spending and territorial government spending also contributed to variations in real GDP growth over the period 2002 to 2007.
In constructing the estimates for the CNMI, BEA used methodologies consistent with the methods used to estimate U.S. GDP. Information from the Economic Census of Island Areas was used to establish levels of GDP for the years 2002 and 2007. Annual series were then developed and used to estimate GDP for the intervening years. Because the CNMI is not included in most of the major surveys used by BEA to estimate U.S. GDP, the support of government leaders in the CNMI and the assistance provided by the CNMI Department of Commerce, the CNMI Department of Finance, and the Commonwealth Ports Authority were critical to the successful production of the estimates presented in this release.
Moving forward, the agreement between OIA and BEA will extend and improve the estimates of GDP for the CNMI. BEA currently plans to release estimates for both 2008 and 2009 in the spring of 2011.
1 These estimates are based on limited source data and are subject to revision.
2 Summary GDP statistics for the CNMI are presented on page 3 of this news release.
3 Consumer spending refers to personal consumption expenditures, inventory investment refers to change in private inventories, and government spending refers to government consumption expenditures and gross investment.
Commonwealth of the Northern Mariana Islands (CNMI)
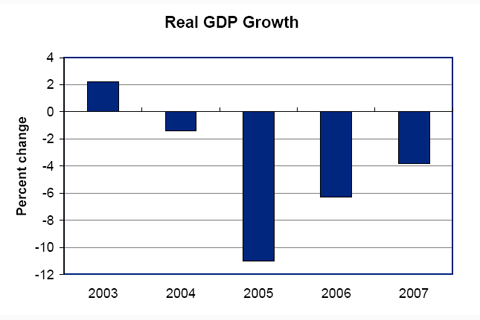
From 2002 to 2007, real GDP of the CNMI decreased at an average annual rate of 4.2 percent. The decrease in real GDP was primarily accounted for by a decrease in the exports of garments (reflecting a contraction in the garment manufacturing industry) and a decline in tourism. In 2005, the garment industry was impacted by reduced quotas on the imports of foreign textiles and garments. Since 2002, a number of economic shocks have contributed to a decline in tourism, including the SARS epidemic and the suspension of flights from Tokyo by Japan Airlines.
| Summary Statistics for the CNMI | |||||||
| 2002 | 2003 | 2004 | 2005 | 2006 | 2007 | 2002-2007 AAGR 1 |
|
| GDP (millions of dollars) | 1,320 | 1,267 | 1,229 | 1,073 | 1,007 | 962 | -6.1% |
| Real GDP (millions of chained 2005 dollars) | 1,197 | 1,223 | 1,206 | 1,073 | 1,006 | 967 | -4.2% |
| Population 2 | 74,372 | 76,617 | 78,889 | 70,636 | 60,662 | 58,629 | -4.6% |
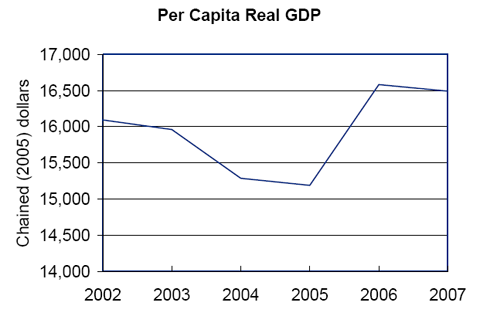
| Real GDP per capita (chained 2005 dollars) | 16,095 | 15,963 | 15,287 | 15,191 | 16,584 | 16,494 | 0.5% |
| 1. Average annual growth rate. 2. Source: U.S. Census Bureau, International Database. |
From 2002 to 2007, the population of the CNMI decreased rapidly as foreign workers left the territory, and as a consequence, real GDP per capita increased at an average annual rate of 0.5 percent.
| CNMI Table 1. Gross Domestic Product |
|||||||
|---|---|---|---|---|---|---|---|
| Line |
[Millions of dollars]
|
||||||
| 2002 | 2003 | 2004 | 2005 | 2006 | 2007 | ||
|
Gross domestic product
|
1 | 1,320 | 1,267 | 1,229 | 1,073 | 1,007 | 962 |
| Personal consumption expenditures | 2 | 538 | 553 | 549 | 511 | 560 | 566 |
| Private fixed investment | 3 | 23 | 22 | 41 | 39 | 33 | 22 |
| Net exports | 4 | 388 | 344 | 292 | 188 | 53 | 20 |
| Exports | 5 | 1,104 | 1,056 | 1,156 | 930 | 752 | 548 |
| Goods | 6 | 875 | 836 | 870 | 694 | 537 | 364 |
| Services | 7 | 229 | 220 | 287 | 235 | 215 | 184 |
| Imports | 8 | 717 | 712 | 864 | 742 | 699 | 529 |
| Goods | 9 | 679 | 673 | 815 | 701 | 663 | 501 |
| Services | 10 | 38 | 39 | 49 | 40 | 37 | 28 |
| Government consumption expenditures and gross investment |
11 | 371 | 347 | 347 | 335 | 362 | 354 |
| Federal | 12 | 11 | 15 | 12 | 11 | 11 | 10 |
| Territorial | 13 | 359 | 332 | 335 | 324 | 351 | 344 |
| CNMI Table 2. Real Gross Domestic Product, Chained Dollars |
|||||||
|---|---|---|---|---|---|---|---|
| Line |
[Millions of chained (2005) dollars]
|
||||||
| 2002 | 2003 | 2004 | 2005 | 2006 | 2007 | ||
|
Gross domestic product
|
1 | 1,197 | 1,223 | 1,206 | 1,073 | 1,006 | 967 |
| Personal consumption expenditures | 2 | 532 | 563 | 549 | 511 | 551 | 549 |
| Private fixed investment | 3 | 25 | 23 | 42 | 39 | 32 | 21 |
| Net exports | 4 | 259 | 263 | 260 | 188 | 79 | 68 |
| Exports | 5 | 1,072 | 1,038 | 1,142 | 930 | 737 | 542 |
| Goods | 6 | 846 | 818 | 861 | 694 | 531 | 360 |
| Services | 7 | 226 | 220 | 281 | 235 | 206 | 180 |
| Imports | 8 | 813 | 775 | 882 | 742 | 657 | 474 |
| Goods | 9 | 775 | 736 | 833 | 701 | 620 | 448 |
| Services | 10 | 38 | 40 | 49 | 40 | 38 | 25 |
| Government consumption expenditures and gross investment |
11 | 382 | 380 | 353 | 335 | 343 | 318 |
| Federal | 12 | 12 | 15 | 12 | 11 | 11 | 10 |
| Territorial | 13 | 369 | 365 | 340 | 324 | 331 | 307 |
| CNMI Table 3. Percent Change From Preceding Year in Real Gross Domestic Product |
||||||
|---|---|---|---|---|---|---|
| Line |
[Percent]
|
|||||
| 2003 | 2004 | 2005 | 2006 | 2007 | ||
|
Gross domestic product
|
1 | 2.2 | -1.4 | -11.0 | -6.3 | -3.8 |
| Personal consumption expenditures | 2 | 5.9 | -2.5 | -7.0 | 7.8 | -0.3 |
| Private fixed investment | 3 | -6.1 | 80.5 | -7.7 | -17.7 | -33.2 |
| Net exports | 4 | …….. | …….. | …….. | …….. | …….. |
| Exports | 5 | -3.2 | 10.0 | -18.6 | -20.7 | -26.5 |
| Goods | 6 | -3.3 | 5.2 | -19.3 | -23.6 | -32.2 |
| Services | 7 | -2.5 | 27.8 | -16.3 | -12.6 | -12.2 |
| Imports | 8 | -4.6 | 13.8 | -15.9 | -11.4 | -27.9 |
| Goods | 9 | -5.1 | 13.2 | -15.8 | -11.6 | -27.7 |
| Services | 10 | 4.1 | 24.7 | -18.2 | -7.0 | -32.4 |
| Government consumption | ||||||
| expenditures and gross investment | 11 | -0.3 | -7.2 | -5.0 | 2.2 | -7.3 |
| Federal | 12 | 24.8 | -18.4 | -9.5 | -0.7 | -9.3 |
| Territorial | 13 | -1.2 | -6.7 | -4.8 | 2.3 | -7.2 |
| CNMI Table 4. Contributions to Percent Change in Real Gross Domestic Product |
||||||
|---|---|---|---|---|---|---|
| Line | ||||||
| 2003 | 2004 | 2005 | 2006 | 2007 | ||
| Percent change: | ||||||
| Gross domestic product | 1 | 2.2 | -1.4 | -11.0 | -6.3 | -3.8 |
| Percentage points: | ||||||
| Personal consumption expenditures | 2 | 2.46 | -1.10 | -3.16 | 3.74 | -0.17 |
| Private fixed investment | 3 | -0.11 | 1.43 | -0.26 | -0.64 | -1.09 |
| Net exports | 4 | -0.07 | 0.32 | -6.17 | -10.05 | 0.15 |
| Exports | 5 | -2.72 | 8.37 | -17.54 | -18.14 | -19.82 |
| Goods | 6 | -2.27 | 3.47 | -13.75 | -15.32 | -17.24 |
| Services | 7 | -0.45 | 4.90 | -3.80 | -2.82 | -2.58 |
| Imports | 8 | 2.65 | -8.05 | 11.37 | 8.09 | 19.97 |
| Goods | 9 | 2.77 | -7.29 | 10.64 | 7.83 | 18.70 |
| Services | 10 | -0.12 | -0.76 | 0.73 | 0.26 | 1.27 |
| Government consumption | ||||||
| expenditures and gross investment | 11 | -0.10 | -2.07 | -1.43 | 0.69 | -2.71 |
| Federal | 12 | 0.23 | -0.22 | -0.10 | -0.01 | -0.11 |
| Territorial | 13 | -0.33 | -1.85 | -1.33 | 0.70 | -2.60 |
| CNMI Table 5. Percent Change From Preceding Year in Prices for Gross Domestic Product and Price Indexes for Gross Domestic Product |
|||||||
|---|---|---|---|---|---|---|---|
| Line |
2002
|
2003
|
2004
|
2005
|
2006
|
2007
|
|
|
[Percent]
|
|||||||
| Gross domestic product | 1 | …….. | -6.1 | -1.6 | -1.9 | 0.1 | -0.7 |
| Personal consumption expenditures | 2 | …….. | -3.0 | 1.8 | 0.1 | 1.6 | 1.5 |
|
[Index numbers, 2005=100]
|
|||||||
| Gross domestic product | 3 | 110.3 | 103.6 | 102.0 | 100.0 | 100.1 | 99.5 |
| Personal consumption expenditures | 4 | 101.2 | 98.2 | 99.9 | 100.0 | 101.6 | 103.1 |
| CNMI Table 6. Gross Domestic Income |
|||||||
|---|---|---|---|---|---|---|---|
| Line |
[Millions of dollars]
|
||||||
| 2002 | 2003 | 2004 | 2005 | 2006 | 2007 | ||
| Gross domestic income | 1 | 1,320 | 1,267 | 1,229 | 1,073 | 1,007 | 962 |
| Compensation of employees | 2 | 678 | 632 | 660 | 555 | 534 | 535 |
| Taxes on production and imports less subsidies | 3 | 128 | 152 | 167 | 165 | 142 | 120 |
| Gross operating surplus | 4 | 514 | 483 | 402 | 354 | 331 | 308 |