
News Release
Gross Domestic Product for Guam, 2002-2007
HAGATNA, GUAM (June 14, 2010) – Today, the Bureau of Economic Analysis (BEA) is releasing its first set of estimates of the major components of gross domestic product (GDP) for Guam.1
Objectively gauging changes in economic activity is difficult in the absence of comprehensive economic metrics, such as the GDP. Until now, a framework did not exist to estimate the GDP of Guam. The Statistical Improvement Program, funded by the Office of Insular Affairs (OIA) of the U.S. Department of the Interior, has made it possible for BEA to develop formal methodologies for measuring the GDP of Guam.
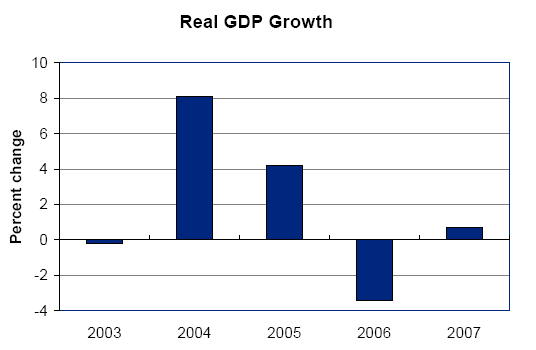
On May 5, 2010, BEA released estimates of total GDP for American Samoa, the Commonwealth of the Northern Mariana Islands, Guam, and the U.S. Virgin Islands. The estimates for Guam showed that from 2002 to 2007, real GDP -- GDP adjusted to remove price changes -- grew at an average annual rate of 1.8 percent.2 (For comparison, the average annual growth rate for the United States (excluding the territories) was 2.8 percent over this period.)
The estimates released today supplement the estimates of total GDP for Guam that were released in May. The accompanying tables present estimates for the major components of GDP, including consumer spending, private fixed investment, net exports, and government spending.3 Also included in this release are estimates of the major components of gross domestic income.
The estimates of the major components of Guam’s GDP show that changes in consumer spending, in government spending (including spending for construction), and in exports of services accounted for much of the year-to-year volatility in real GDP growth.
In constructing the estimates for Guam, BEA used methodologies consistent with the methods used to estimate U.S. GDP. Information from the Economic Census of Island Areas was used to establish levels of GDP for the years 2002 and 2007. Annual series were then developed and used to estimate GDP for the intervening years. Because Guam is not included in most of the major surveys used by BEA to estimate U.S. GDP, the support of government leaders in Guam and the assistance provided by the Guam Bureau of Statistics and Plans, the Guam Department of Revenue and Taxation, the Guam Bureau of Labor Statistics, and the Guam Bureau of Budget and Management Research were critical to the successful production of the estimates presented in this release.
Moving forward, the agreement between OIA and BEA will extend and improve the estimates of GDPfor Guam. BEA currently plans to release estimates for both 2008 and 2009 in the spring of 2011.
1 These estimates are based on limited source data and are subject to revision.
2 Summary GDP statistics for Guam are presented on page 3 of this news release.
3 Consumer spending refers to personal consumption expenditures and government spending refers to government consumption expenditures and gross investment.
Guam
From 2002 to 2007, real GDP of Guam grew at an average annual rate of 1.8 percent. Year-to-year fluctuations in economic growth reflected changes in construction activity and in tourism. Guam's economy was significantly affected by a number of economic shocks over this period, including Typhoon Pongsona, the SARS epidemic, the outbreak of avian flu, and the financial downturn in Asia.
| Summary Statistics for Guam | |||||||
| 2002 | 2003 | 2004 | 2005 | 2006 | 2007 | 2002-2007 AAGR 1 |
|
| GDP (millions of dollars) | 3,568 | 3,542 | 3,846 | 4,100 | 4,176 | 4,280 | 3.7% |
| Real GDP (millions of chained 2005 dollars) | 3,651 | 3,643 | 3,936 | 4,100 | 3,959 | 3,988 | 1.8% |
| Population 2 | 161,057 | 163,593 | 166,090 | 168,564 | 171,019 | 173,456 | 1.5% |
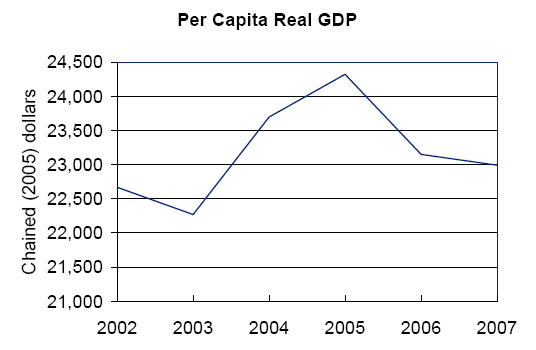
| Real GDP per capita (chained 2005 dollars) | 22,669 | 22,269 | 23,698 | 24,323 | 23,149 | 22,991 | 0.3% |
| 1. Average annual growth rate. 2. Source: U.S. Census Bureau, International Database. |
From 2002 to 2007, the population of Guam increased at an average annual rate of 1.5 percent, and real GDP per capita increased at an average annual rate of 0.3 percent.
| Guam Table 1. Gross Domestic Product |
|||||||
|---|---|---|---|---|---|---|---|
| Line |
[Millions of dollars]
|
||||||
| 2002 | 2003 | 2004 | 2005 | 2006 | 2007 | ||
|
Gross domestic product
|
1 | 3,568 | 3,542 | 3,846 | 4,100 | 4,176 | 4,280 |
| Personal consumption expenditures | 2 | 2,359 | 2,189 | 2,366 | 2,589 | 2,660 | 2,783 |
| Private fixed investment | 3 | 95 | 130 | 126 | 122 | 140 | 180 |
| Net exports | 4 | -368 | -444 | -363 | -453 | -507 | -690 |
| Exports | 5 | 611 | 544 | 741 | 839 | 812 | 814 |
| Goods | 6 | 50 | 43 | 53 | 52 | 53 | 91 |
| Services | 7 | 561 | 501 | 688 | 788 | 759 | 723 |
| Imports | 8 | 979 | 988 | 1,103 | 1,292 | 1,318 | 1,504 |
| Goods | 9 | 958 | 966 | 1,076 | 1,263 | 1,288 | 1,463 |
| Services | 10 | 21 | 22 | 28 | 30 | 31 | 41 |
| Government consumption expenditures and gross investment |
11 | 1,482 | 1,668 | 1,717 | 1,842 | 1,883 | 2,006 |
| Federal | 12 | 861 | 993 | 1,031 | 1,080 | 1,077 | 1,142 |
| Territorial | 13 | 620 | 675 | 686 | 762 | 806 | 864 |
| Guam Table 2. Real Gross Domestic Product, Chained Dollars |
|||||||
|---|---|---|---|---|---|---|---|
| Line |
[Millions of chained (2005) dollars]
|
||||||
| 2002 | 2003 | 2004 | 2005 | 2006 | 2007 | ||
|
Gross domestic product
|
1 | 3,651 | 3,643 | 3,936 | 4,100 | 3,959 | 3,988 |
| Personal consumption expenditures | 2 | 2,503 | 2,293 | 2,455 | 2,589 | 2,554 | 2,601 |
| Private fixed investment | 3 | 111 | 148 | 135 | 122 | 131 | 164 |
| Net exports | 4 | -657 | -571 | -451 | -453 | -557 | -703 |
| Exports | 5 | 736 | 628 | 801 | 839 | 761 | 744 |
| Goods | 6 | 58 | 48 | 56 | 52 | 51 | 83 |
| Services | 7 | 677 | 580 | 745 | 788 | 710 | 662 |
| Imports | 8 | 1,393 | 1,199 | 1,252 | 1,292 | 1,318 | 1,448 |
| Goods | 9 | 1,372 | 1,176 | 1,223 | 1,263 | 1,288 | 1,408 |
| Services | 10 | 22 | 24 | 29 | 30 | 30 | 39 |
| Government consumption expenditures and gross investment |
11 | 1,653 | 1,763 | 1,797 | 1,842 | 1,830 | 1,923 |
| Federal | 12 | 958 | 1,055 | 1,069 | 1,080 | 1,026 | 1,084 |
| Territorial | 13 | 694 | 708 | 728 | 762 | 805 | 841 |
| Guam Table 3. Percent Change From Preceding Year in Real Gross Domestic Product |
||||||
|---|---|---|---|---|---|---|
| Line |
[Percent]
|
|||||
| 2003 | 2004 | 2005 | 2006 | 2007 | ||
|
Gross domestic product
|
1 | -0.2 | 8.1 | 4.2 | -3.4 | 0.7 |
| Personal consumption expenditures | 2 | -8.4 | 7.0 | 5.5 | -1.3 | 1.8 |
| Private fixed investment | 3 | 32.9 | -8.5 | -9.5 | 7.0 | 24.9 |
| Net exports | 4 | |||||
| Exports | 5 | -14.6 | 27.4 | 4.8 | -9.4 | -2.1 |
| Goods | 6 | -16.9 | 15.5 | -7.3 | -2.0 | 63.6 |
| Services | 7 | -14.4 | 28.5 | 5.8 | -9.9 | -6.8 |
| Imports | 8 | -13.9 | 4.4 | 3.2 | 2.0 | 9.9 |
| Goods | 9 | -14.3 | 4.0 | 3.2 | 2.0 | 9.3 |
| Services | 10 | 5.8 | 21.6 | 3.6 | -1.0 | 32.2 |
| Government consumption | ||||||
| expenditures and gross investment | 11 | 6.7 | 2.0 | 2.5 | -0.6 | 5.1 |
| Federal | 12 | 10.0 | 1.4 | 1.0 | -5.0 | 5.6 |
| Territorial | 13 | 2.0 | 2.9 | 4.6 | 5.7 | 4.4 |
| Guam Table 4. Contributions to Percent Change in Real Gross Domestic Product |
||||||
|---|---|---|---|---|---|---|
| Line | ||||||
| 2003 | 2004 | 2005 | 2006 | 2007 | ||
| Percent change: | ||||||
| Gross domestic product | 1 | -0.2 | 8.1 | 4.2 | -3.4 | 0.7 |
| Percentage points: | ||||||
| Personal consumption expenditures | 2 | -5.60 | 4.36 | 3.38 | -0.83 | 1.18 |
| Private fixed investment | 3 | 0.89 | -0.32 | -0.32 | 0.21 | 0.84 |
| Net exports | 4 | 1.64 | 3.08 | -0.02 | -2.54 | -3.56 |
| Exports | 5 | -2.57 | 4.35 | 0.96 | -1.94 | -0.41 |
| Goods | 6 | -0.24 | 0.19 | -0.10 | -0.03 | 0.82 |
| Services | 7 | -2.33 | 4.15 | 1.06 | -1.91 | -1.23 |
| Imports | 8 | 4.21 | -1.27 | -0.98 | -0.60 | -3.15 |
| Goods | 9 | 4.24 | -1.13 | -0.96 | -0.61 | -2.91 |
| Services | 10 | -0.03 | -0.14 | -0.03 | 0.01 | -0.24 |
| Government consumption | ||||||
| expenditures and gross investment | 11 | 2.85 | 0.93 | 1.11 | -0.27 | 2.28 |
| Federal | 12 | 2.50 | 0.39 | 0.27 | -1.30 | 1.43 |
| Territorial | 13 | 0.36 | 0.54 | 0.84 | 1.03 | 0.85 |
| Guam Table 5. Percent Change From Preceding Year in Prices for Gross Domestic Product and Price Indexes for Gross Domestic Product |
|||||||
|---|---|---|---|---|---|---|---|
| Line |
2002
|
2003
|
2004
|
2005
|
2006
|
2007
|
|
|
[Percent]
|
|||||||
| Gross domestic product | 1 | …….. | -0.5 | 0.5 | 2.4 | 5.5 | 1.7 |
| Personal consumption expenditures | 2 | …….. | 1.2 | 1.0 | 3.7 | 4.1 | 2.8 |
|
[Index numbers, 2005=100]
|
|||||||
| Gross domestic product | 3 | 97.7 | 97.2 | 97.7 | 100.0 | 105.5 | 107.3 |
| Personal consumption expenditures | 4 | 94.3 | 95.4 | 96.4 | 100.0 | 104.1 | 107.0 |
| Guam Table 6. Gross Domestic Income |
|||||||
|---|---|---|---|---|---|---|---|
| Line |
[Millions of dollars]
|
||||||
| 2002 | 2003 | 2004 | 2005 | 2006 | 2007 | ||
| Gross domestic income | 1 | 3,568 | 3,542 | 3,846 | 4,100 | 4,176 | 4,280 |
| Compensation of employees | 2 | 1,879 | 2,096 | 2,123 | 2,204 | 2,293 | 2,409 |
| Taxes on production and imports less subsidies | 3 | 94 | 127 | 154 | 163 | 165 | 194 |
| Gross operating surplus | 4 | 1,595 | 1,320 | 1,568 | 1,733 | 1,718 | 1,677 |