News Release
Revised Gross Domestic Product by Industry, 2009
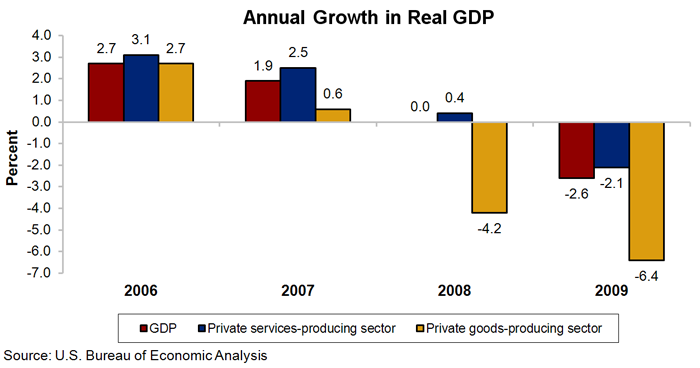
Downturns in durable-goods manufacturing and professional, scientific, and technical services along with the continued contraction of construction were among the leading contributors to the decline in U.S. economic growth in 2009, according to revised statistics on the breakout of real gross domestic product (GDP) by industry from the Bureau of Economic Analysis. The revised statistics reflect the incorporation of newly available source data, primarily revised corporate profits by industry.1 The economic downturn was widespread with 16 of 22 major industry groups contributing to the decline in real GDP growth.
- Manufacturing value addeda measure of an industrys contribution to GDPdeclined for the second consecutive year, falling 8.6 percent in 2009, more sharply than the 4.8 percent decline in 2008. Durable-goods manufacturing decreased 12.7 percent in 2009 after growing 1.0 percent in 2008. Nondurable-goods manufacturing declined at a slower rate of 3.4 percent in 2009, compared with the 11.8 percent drop in 2008.
- Construction declined for the fifth consecutive year, falling 15.6 percent in 2009, compared to a decline of 5.7 percent in 2008.
- Professional, scientific and technical services turned down in 2009, falling 3.4 percent, after increasing 4.2 percent in 2008.
Prices:
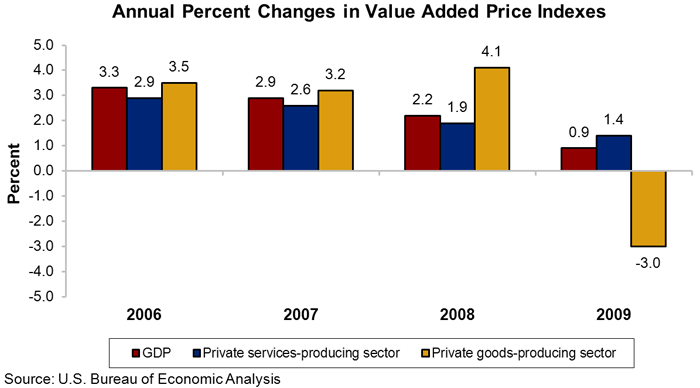
Declines in value added prices for mining, wholesale trade, and agriculture were the largest contributors to the slowdown in the GDP price index for 2009. Value added prices measure changes in an industrys labor and capital input prices, including profit margins.
- Prices for mining fell sharply in 2009, decreasing 40.4 percent after increasing 29.1 percent in 2008, primarily reflecting steep declines in prices for petroleum, natural gas, and other mining products.
- Prices for agriculture fell 21.0 percent in 2009, after increasing 1.4 percent in 2008, primarily reflecting decreases in most crop and livestock commodity prices.