
News Release
Revised Statistics of Gross Domestic Product by Industry, 2010
Recoveries in durable-goods manufacturing, wholesale trade, and professional, scientific and technical services industries were the leading contributors to the turnaround in U.S. economic growth in 2010, according to revised statistics on the breakout of real gross domestic product (GDP) by industry from the Bureau of Economic Analysis. Overall, 16 of 22 industry groups contributed to real GDP growth.
- Manufacturing value addeda measure of an industrys contribution to GDP rose 11.2 percent, a sharp return to growth after two consecutive years of decline. Durable-goods manufacturing rose 17.0 percent in 2010 after declining 14.9 percent in 2009. Nondurable-goods manufacturing increased 5.1 percent in 2010 after falling 2.7 percent in 2009.
- Wholesale trade value added grew 3.9 percent in 2010, after two years of decline, reflecting strong growth in motor vehicle wholesalers.
- Six of 22 industry groups contracted in 2010. The largest contributors were real estate and construction, which fell for the sixth consecutive year at 3.2 percent.
Prices:
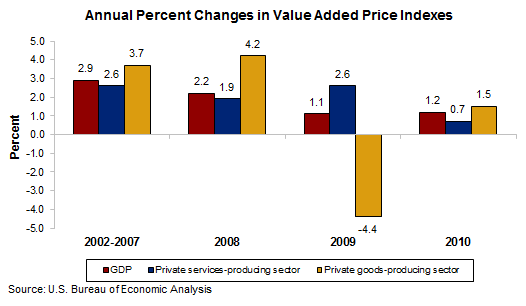
Overall growth in value added prices remained low, increasing 1.2 percent in 2010 after increasing 1.1 percent in 2009. Upturns in mining and agriculture prices were among the largest contributors to the slight acceleration in the GDP price index for 2010. Value added prices measure changes in an industrys unit costs of capital and labor inputs, as well as the profits per unit of output, and reflect the productivity of capital and labor used by the industry.
- Value added prices for mining increased nearly 20 percent in 2010 after sharply declining 45 percent in 2009, primarily reflecting increases in prices for oil and gas extraction.
- Value added prices for the agriculture sector rose about 16 percent in 2010 after decreasing over 20 percent in 2009, primarily reflecting increases in farm prices.
- Value added prices for the goods-producing sector turned up in 2010, increasing 1.5 percent after decreasing 4.4 percent in 2009. Value added prices for the private services-producing sector decelerated in 2010, increasing 0.7 percent after increasing 2.6 percent in 2009.
Other highlights:
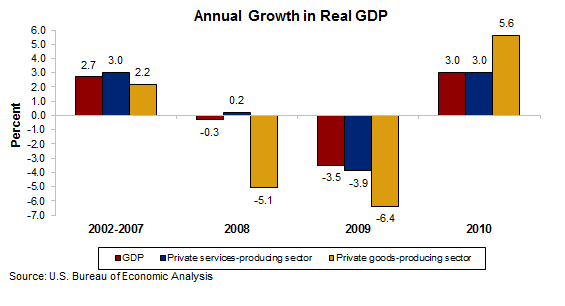
- Real value added for the private goods-producing sector grew 5.6 percent in 2010, after two consecutive years of decline.
- The information-communications-technology-producing industries returned to its pre-business cycle trend of double-digit growth, increasing 14.7 percent in 2010 after two consecutive years of single-digit growth.
- Retail trade value added grew 10.1 percent in 2010, after declining 2.4 percent in 2009, reflecting increased consumer demand.
Summary of Revisions of the Annual Industry Accounts
The estimates released today reflect the results of the flexible annual revision of the annual industry accounts for 2003-20101. This revision incorporates improvements in source data and statistical methods that update the accounts to more accurately portray the evolving U.S. economy. The improvements did not meaningfully alter the overall picture of the economy over the period from 2003-2010. Major changes introduced with this revision include:
- Incorporating wholesale trade margin price indexes from the Bureau of Labor Statistics, which replace sales-based price indexes used to deflate wholesale trade margin output for the years 2008 forward.
- Introducing Medical Expenditure Panel Survey (MEPS) and private trade source data to replace the benefits-to-premiums ratio based on the 2002 Economic Census data. These data were incorporated for all revision years beginning in 2004.
- Incorporating the Annual Retail Trade Survey and the Service Annual Survey, which have been benchmarked to the 2007 Economic Census, back to 2003.
- Incorporating improved quality-adjusted price indexes from the Federal Reserve Boards Industrial Production Index program for communications equipment, for 2003 forward, to replace indexes based on the BLS Producer Price Index and import price indexes.
More information on this revision will be available on BEAs website at www.bea.gov/industry, including a link to an article in the December 2011 issue of the Survey of Current Business that describes in more detail the major changes listed above.
BEAs national, international, regional, and industry estimates; the Survey of Current Business; and BEA news releases are available without charge on BEAs Web site at www.bea.gov. By visiting the site, you can also subscribe to receive free e-mail summaries of BEA releases and announcements.
Advance statistics of gross domestic product (GDP) by industry for 2011 will be released on April 26, 2012 at 8:30 A.M. EDT.
1 For additional information on the reasoning, impact, and scope of the flexible annual revision please refer to the briefing Improving BEAs Accounts Through Flexible Annual Revisions in the June 2008 issue of the Survey of Current Business at: /scb/toc/0608cont.htm