
News Release
Gross Domestic Product by State, 2012 (advance estimate) and 2009-2011 (revised estimate)
EMBARGOED UNTIL RELEASE AT 8:30 A.M. EDT, THURSDAY, JUNE 6, 2013
| Technical: Clifford Woodruff | (202) | 606–9234 | ||
| Technical: Catherine Wang | (202) | 606–9670 | ||
| Media: Jeannine Aversa | (202) | 606–2649 | BEA 13—25 | |
| E–mail inquiries: | gdpbystate@bea.gov |
Advance 2012 and Revised 2009—2011 GDP–by–State Statistics
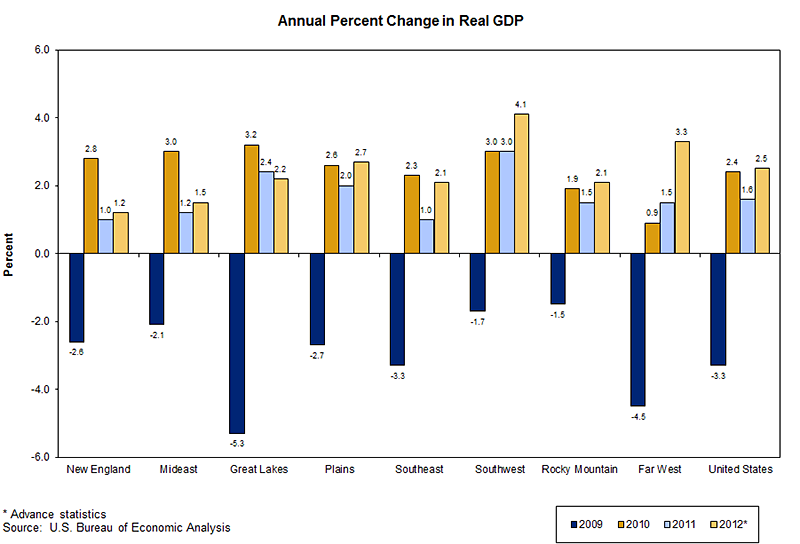
Real gross domestic product (GDP) increased in 49 states and the District of Columbia in 2012, according to new statistics released today by the U.S. Bureau of Economic Analysis (BEA) that breakdown GDP by state.1 Durable–goods manufacturing, finance and insurance, and wholesale trade were the leading contributors to real U.S. economic growth. U.S. real GDP by state grew 2.5 percent in 2012 after a 1.6 percent increase in 2011.2
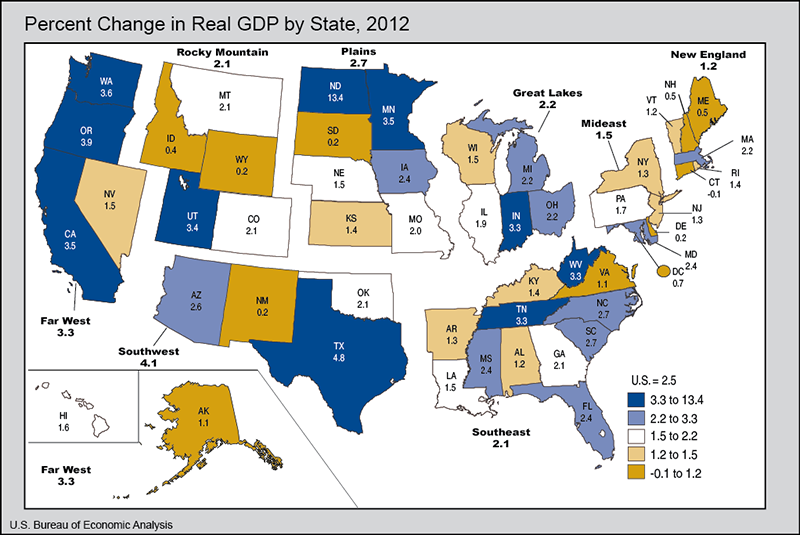
Real GDP increased in all eight BEA regions in 2012, with growth accelerating in seven of eight regions. The Great Lakes region was the only region where growth decelerated relative to growth in 2011. The Southwest region grew the fastest (4.1 percent), led by Texas with a 4.8 percent increase.
Durable–goods manufacturing was the largest contributor to U.S. real GDP by state growth in 2012. This industry increased 9.1 percent in 2012, after increasing 6.8 percent in 2011. It was the leading contributor to real GDP growth in seven of the eight BEA regions and in 22 states. Durable–goods manufacturing contributed 2.87 percentage points to growth in Oregon and 1.70 percentage points to growth in Indiana.
Finance and insurance was also a leading contributor to U.S. real GDP by state growth. Finance and insurance increased 3.6 percent in 2012, rebounding from –0.6 percent in 2011. This industry contributed to growth in seven of eight BEA regions and was the leading contributor to growth in the Mideast region. Finance and insurance contributed 0.75 percentage point or more to the growth of real GDP in Utah, South Dakota, and Delaware.
Wholesale trade contributed to real GDP growth in 48 states and the District of Columbia. Wholesale trade increased 4.8 percent in 2012, after increasing 3.0 percent in 2011. It was the largest contributor to real GDP growth in New Jersey and Maine.
Although mining was not a major contributor to real GDP growth for the nation, it was a large contributor in North Dakota, West Virginia, and Texas. In North Dakota, the fastest growing state in 2012, mining contributed 3.26 percentage points to real GDP growth of 13.4 percent.
Construction turned up in 2012, after eight consecutive years of contraction; increasing by 3.2 percent nationally. This industry contributed to real GDP growth in 43 states and the District of Columbia.
In contrast, agriculture, forestry, fishing, and hunting subtracted from real GDP growth in 2012. This industry subtracted from real GDP growth in six of eight BEA regions and in 35 states.3 In South Dakota, agriculture, forestry, fishing, and hunting subtracted 2.03 percentage points from real GDP growth.
Per capita real GDP by state in 2012. Per capita real GDP ranged from a high of $61,183 in Delaware to a low of $28,944 in Mississippi. Per capita real GDP for the U.S. was $42,784.
Revisions. The statistics released today reflect the regular annual revision of GDP by state for 2009—2011. Annual revisions incorporate source data that are more complete, more detailed, and otherwise more reliable than those previously available. Revisions primarily reflected the incorporation of newly available and revised annual source data (e.g., Census's Annual Survey of Manufactures and State and Local Government Finances) and BEA's GDP by industry statistics. Compared with the previously published statistics, the overall picture of the U.S. economy for 2009—2011 did not change.
For 2011, only in the states of Hawaii, Louisiana, and South Dakota was the absolute revision larger than 3.5 percent. The advance statistics for 2011, released in June 2012, correctly indicated the direction of change for 42 states and the District of Columbia and also correctly identified whether a state grew at a faster or slower pace than U.S. GDP growth for 33 states and the District of Columbia. For 2010, only Hawaii, Louisiana, Oregon and Vermont had revisions larger than two percent in absolute terms. For 2009, no states had revisions larger than two percent in absolute terms.
Tables 1–4 show these results in more detail; complete detail is available on BEA's Web site at www.bea.gov.
The next release of GDP by state is scheduled for the summer of 2014. The release will include revised statistics for 1997—2012 and advance statistics for 2013.
Advance Statistics of GDP by State for 2012 by NAICS Sector
The advance statistics of GDP by state for 2012 are based on source data that are incomplete or subject to further revision by the source agency. Revised statistics, based on more complete data, will be released in the summer of 2014.
More information on the methodology used to produce the advance 2012 statistics, on the revised GDP–by–state statistics for 2009—2011, and on revisions to the GDP–by–state statistics will appear in an article in the July 2013 issue of the Survey of Current Business, BEA's monthly journal.
Explanatory Notes
Definitions. GDP by state is the state counterpart of the Nation's gross domestic product (GDP), the Bureau's featured and most comprehensive measure of U.S. economic activity. GDP by state is derived as the sum of the GDP originating in all the industries in a state.
The statistics of real GDP by state are prepared in chained (2005) dollars. Real GDP by state is an inflation–adjusted measure of each state's gross product that is based on national prices for the goods and services produced within that state. The statistics of real GDP by state and of quantity indexes with a base year of 2005 were derived by applying national chain–type price indexes to the current–dollar GDP–by–state values for the 64 detailed NAICS–based industries for 1997 forward.
The chain–type index formula that is used in the national accounts is then used to calculate the values of total real GDP by state and of real GDP by state at more aggregated industry levels. Real GDP by state may reflect a substantial volume of output that is sold to other states and countries. To the extent that a state's output is produced and sold in national markets at relatively uniform prices (or sold locally at national prices), real GDP by state captures the differences across states that reflect the relative differences in the mix of goods and services that the states produce. However, real GDP by state does not capture geographic differences in the prices of goods and services that are produced and sold locally.
Relation of GDP by state to U.S. Gross Domestic Product (GDP). An industry's GDP by state, or its value added, in practice, is calculated as the sum of incomes earned by labor and capital and the costs incurred in the production of goods and services. That is, it includes the wages and salaries that workers earn, the income earned by individual or joint entrepreneurs as well as by corporations, and business taxes such as sales, property, and Federal excise taxes—that count as a business expense.
GDP is calculated as the sum of what consumers, businesses, and government spend on final goods and services, plus investment and net foreign trade. In theory, incomes earned should equal what is spent, but due to different data sources, income earned, usually referred to as gross domestic income (GDI), does not always equal what is spent (GDP). The difference is referred to as the "statistical discrepancy."
Starting with the 2004 comprehensive revision, BEA's annual industry accounts and its GDP–by–state accounts allocate the statistical discrepancy across all private–sector industries. Therefore, the GDP–by–state statistics are now conceptually more similar to the GDP statistics in the national accounts than they had been in the past.
U.S. real GDP by state for the advance year, 2012, may differ from the Annual Industry Accounts' GDP by industry and, hence NIPA (National Income and Product Account) GDP, because of different sources and vintages of data used to estimate GDP by state and NIPA GDP. For the revised years of 2009—2011, U.S. GDP by state is nearly identical to GDP by industry except for small differences resulting from the GDP–by–state accounts' exclusion of overseas Federal military and civilian activity (because it cannot be attributed to a particular state). The GDP–by–industry statistics are identical to those from the 2012 annual revision of the NIPAs, released in July 2012. However, because of revisions since July 2012, GDP in the NIPAs may differ from U.S. GDP by state.
BEA's national, international, regional, and industry statistics; the Survey of Current Business; and BEA news releases are available without charge on BEA's Web site at www.bea.gov. By visiting the site, you can also subscribe to receive free e–mail summaries of BEA releases and announcements.
1. Real GDP by state is an inflation–adjusted measure of each state's production based on a weighted average of national prices for those products produced within each state. For a further description, see the "Explanatory Notes" section in this release.
2. For an explanation of the small difference between real GDP by state and real GDP in the national income and product accounts (NIPAs), see the section "Relation of GDP by state to U.S. Gross Domestic Product."
3. Values for contributions to growth shown in Table 2 have been rounded. Of the 35 states with negative contributions to growth in agriculture, forestry, fishing, and hunting, four round to 0.00.