
News Release
Local Area Personal Income, 2001-2012 (benchmark estimate)
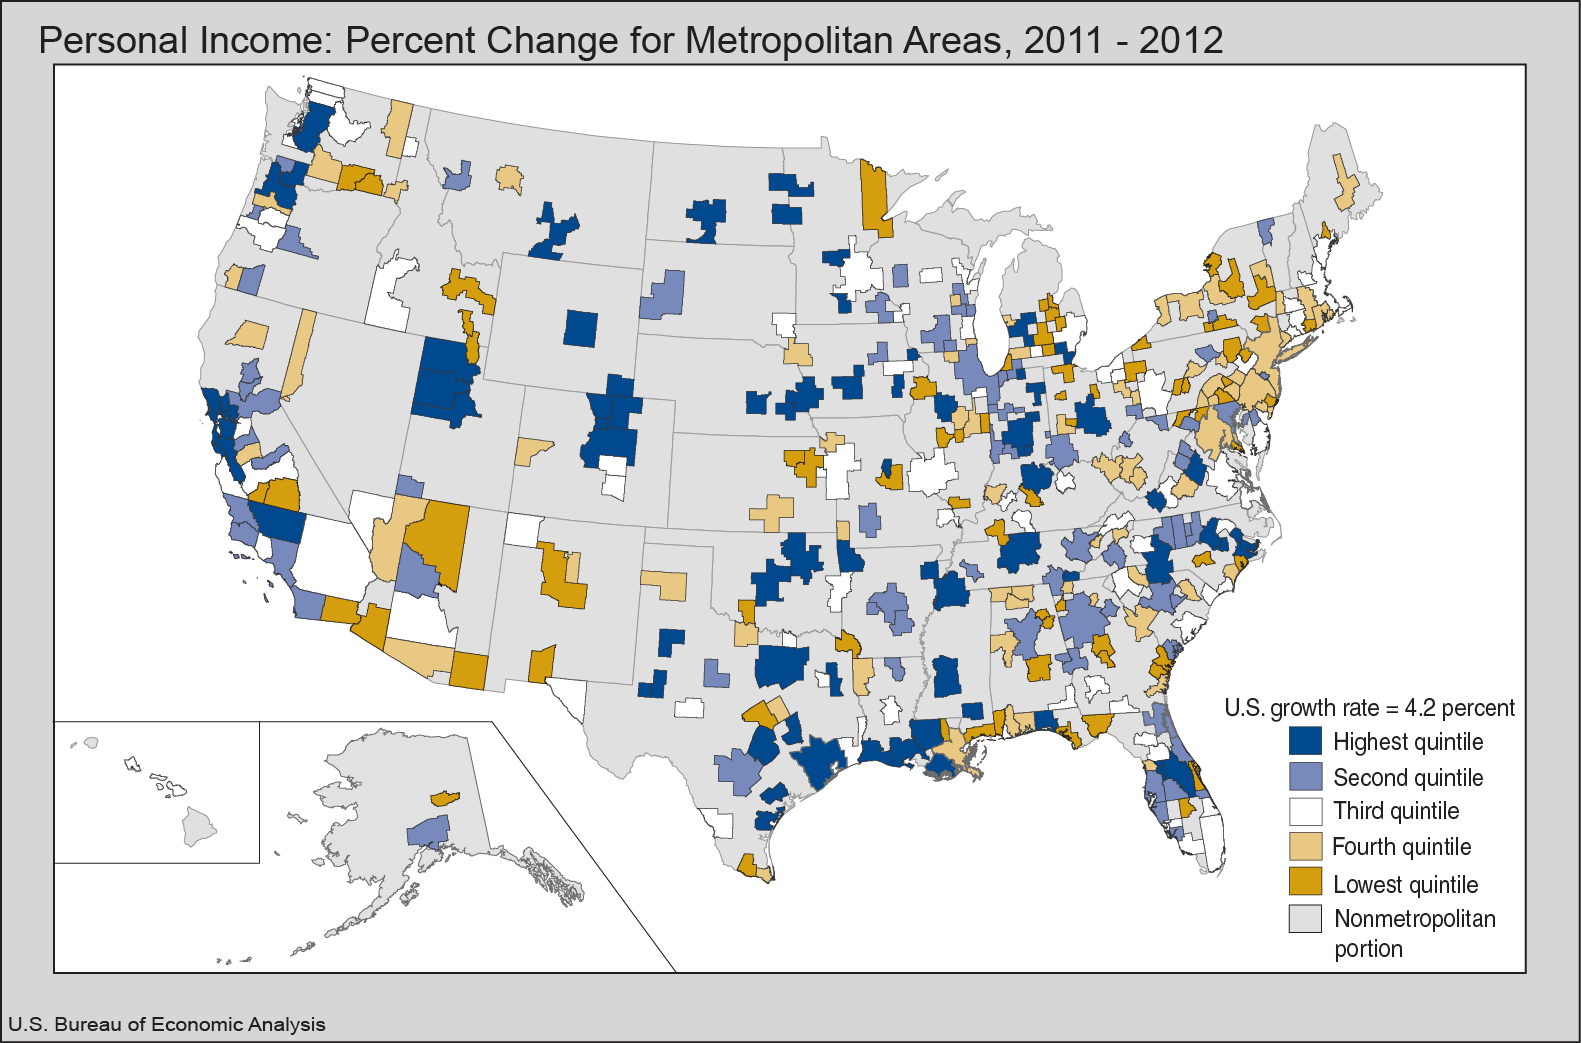
Personal income growth slowed in 2012 in most of the nations 381 metropolitan statistical areas (MSAs), according to estimates released today by the U.S. Bureau of Economic Analysis. Personal income growth slowed in 311 MSAs, accelerated in 65 MSAs, and remained unchanged in 5 MSAs. On average, MSA personal income rose 4.2 percent in 2012, after growing 6.0 percent in 2011. Personal income growth ranged from 12.1 percent in Midland, Texas to -1.6 percent in Yuma, Arizona, one of only five MSAs where personal income declined in 2012. Inflation, as measured by the national price index for personal consumption expenditures, slowed to 1.8 percent in 2012 from 2.4 percent in 2011.
Midland, Texas was the fastest growing MSA, in terms of personal income, for the third year in a row. Odessa, Texas, which grew 11.5 percent, was second fastest, as it was in 2011. For both MSAs, the mining industry, which includes oil and gas extraction, contributed more than any other industry to personal income growth. North Dakotas three MSAs were also among the fastest growing MSAs in the country in 2012: Grand Forks grew 10.5 percent and ranked third, Bismarck ranked fourth (10.1 percent), and Fargo ranked sixth (8.3 percent). Personal income in the nonmetropolitan portion of North Dakota—where the booming mining industry is located—grew at an even faster 26.3 percent pace.
Declines in farm and military earnings, which were relatively small nationally, accounted for the personal income declines in four of the five slowest growing MSAs. In Hanford, California and Yuma, Arizona, farm earnings fell 13.3 percent and 57.5 percent, respectively (while falling only 1.2 percent for the nation). In Elizabethtown, Kentucky and Watertown, New York, military earnings fell 14.4 percent and 4.6 percent, respectively (but fell only 0.7 percent for the nation). Personal income also fell in 2012 in Kennewick, Washington. A temporary infusion of American Recovery and Reinvestment Act funds for environmental cleanup in Kennewick peaked in 2011; since then, earnings in the administrative and waste management services industry have fallen 20.5 percent (compared to a 6.1 percent increase nationally).
Large MSAs. Among the 52 MSAs with a population of one million or more, personal income grew 4.4 percent on average in 2012 (down from 6.3 percent in 2011) and ranged from 7.8 percent in Nashville, Tennessee to 3.0 percent in Philadelphia, Pennsylvania, Providence, Rhode Island, and Buffalo, New York. Professional services, the largest industry in the large MSAs, contributed most to personal income growth in 2012. By way of comparison, the 329 small MSAs with populations below one million grew 3.8 percent on average in 2012, down from 5.6 percent in 2011. Health care was the largest industry among this group of MSAs, and it contributed more than any other industry to personal income growth in 2012.
Per capita personal income. Per capita personal income growth rates ranged from 9.5 percent in Grand Forks, North Dakota to -2.8 percent in Kennewick, Washington.
Nonmetropolitan counties. Personal income grew 3.7 percent in nonmetropolitan counties in 2012, compared to 4.2 percent growth in metropolitan counties. The slower growth of the nonmetropolitan counties reflects the dominance of farming and government services in that portion of the U.S. and the much lower earnings growth of those sectors. Nationally, farm earnings fell 1.2 percent and government earnings rose 0.6 percent in 2012. In contrast, earnings in the private nonfarm sector grew 5.1 percent.
Today, the Bureau of Economic Analysis begins releasing the results of a comprehensive (or benchmark) revision of its local area personal income statistics. Initially, new and revised statistics have been released for the years covered by the North American Industry Classification System; i.e., from 2001 through 2012. Statistics for counties, metropolitan statistical areas, micropolitan statistical areas, combined statistical areas, metropolitan divisions, and state metro/nonmetro portions are now available interactively on BEAs Web site. Revisions back to 1969 are scheduled to be released in the spring of 2014.
NOTE.— MSA names in the text are abbreviated; full names are provided in Table 1.
Definitions
Personal income is the income received by all persons from all sources. Personal income is the sum of net earnings by place of residence, property income, and personal current transfer receipts. Net earnings is earnings by place of work (the sum of wages and salaries, supplements to wages and salaries, and proprietors income) less contributions for government social insurance, plus an adjustment to convert earnings by place of work to a place-of-residence basis. Property income is rental income of persons, personal dividend income, and personal interest income. Personal income is measured before the deduction of personal income taxes and other personal taxes and is reported in current dollars (no adjustment is made for price changes).
Per capita personal income is calculated as the personal income of the residents of a given area divided by the resident population of the area. In computing per capita personal income, BEA uses the Census Bureaus annual midyear population estimates.
The metropolitan statistical areas used by BEA are the county-based areas developed by the Office of Management and Budget (OMB) for federal statistical purposes and last updated in February 2013. Metropolitan statistical areas have at least one urbanized area of 50,000 or more population, plus adjacent territory that has a high degree of social and economic integration with the core as measured by commuting ties. Personal income and per capita personal income estimates for the 381 metropolitan statistical areas are shown in Table 1.
Availability of data on the BEA Web site
The complete set of local area personal income statistics for 2001–2012 for counties, metropolitan statistical areas, micropolitan statistical areas, combined statistical areas, metropolitan divisions, and state metro/nonmetro portions is now available interactively on BEAs Web site. Go to www.bea.gov/iTable/index_regional.cfm to access these statistics which include earnings and compensation by industry, gross earnings inflows and outflows associated with commuters, and other components of personal income. In addition, the Web site has mapping and charting software and a detailed methodology.
BEA Regional Facts (BEARFACTS), a narrative summary of personal income, per capita personal income, and components of income for counties, metropolitan statistical areas and states, is available on BEAs Web site. Go to www.bea.gov/regional/bearfacts/ to access these summaries.
****
An article about the local area personal income statistics, describing the comprehensive revision, data sources, and other special features will be published in the December issue of the Survey of Current Business, the monthly journal of the Bureau of Economic Analysis.
****
BEAs national, international, regional, and industry statistics; the Survey of Current Business; and BEA news releases are available without charge on BEAs Web site at www.bea.gov. By visiting the site, you can also subscribe to receive free e-mail alerts of BEA news releases and announcements.
****
The next data release with local area statistics, scheduled for April 24, 2014 at 8:30 A.M., will be Real Personal Income for State and Metropolitan Areas, 2008–2012.