
News Release
Comprehensive Revision of the Annual Industry Accounts, 2014
Widespread Growth Across Industries in 2012
Revised Statistics of Gross Domestic Product by Industry for 1997-2012
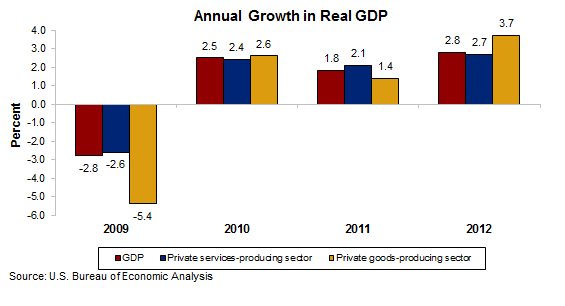
With this release, the Bureau of Economic Analysis (BEA) has provided new and expanded detail on the industry sources of U.S. economic growth in 2012. These newly available data, which reflect the results of the 2014 comprehensive revision of the annual industry accounts, confirm the widespread growth in 2012. Overall, 20 of 22 industry groups contributed to the 2.8 percent increase in real GDP. Professional and business services; finance, insurance, real estate, rental, and leasing; mining; and manufacturing were the leading contributors to growth.
- Professional, scientific, and technical services real value added—a measure of an industry’s contribution to GDP—increased 4.2 percent in 2012, continuing to reflect strong growth in computer systems design and related services.
- Real estate and rental and leasing increased 2.2 percent in 2012, the third consecutive year of positive real value added growth.
- Mining rose 14.0 percent in 2012, after increasing 9.9 percent in 2011, reflecting strong growth for oil and gas extraction.
Prices:
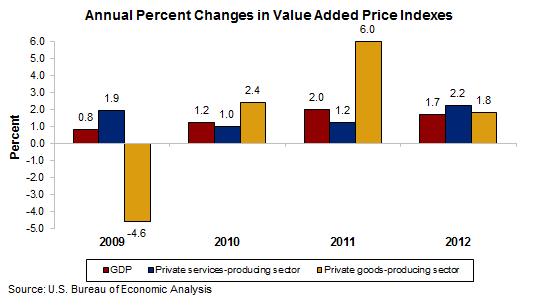
Value added prices modestly decelerated in 2012, increasing 1.7 percent after increasing 2.0 percent in 2011. Mining and agriculture, forestry, fishing, and hunting were the largest contributors to the deceleration in the GDP price index for 2012. Value added prices measure changes in an industry’s unit costs of capital and labor inputs and reflect the productivity of capital and labor used by the industry.
- Value added prices for the goods-producing sector decelerated in 2012, increasing 1.8 percent after increasing 6.0 percent in 2011. In contrast, value added prices for the services-producing sector accelerated, increasing 2.2 percent after increasing 1.2 percent in 2011.
- Value added prices for mining turned down in 2012, decreasing 8.0 percent after increasing 11.8 percent in 2011.
- Value added prices for agriculture, forestry, fishing, and hunting decelerated in 2012, increasing 1.4 percent after increasing 28.5 percent in 2011.
Other highlights:
- Real value added for manufacturing rose 1.9 percent in 2012, after increasing 0.7 percent in 2011.
- Real value added for information increased 4.4 percent in 2012, after increasing 2.2 percent in 2011. This is the industry’s strongest growth since 2008.
- Construction increased 4.0 percent, its first significant increase since 2004.
- Information-communications-technology producing industries accelerated in 2012, increasing 7.2 percent after increasing 4.7 percent in 2011.
- Manufacturing’s current-dollar share of GDP increased for the third consecutive year, to 12.5 percent, its highest share since 2007.
Comprehensive Revision of the Annual Industry Accounts
The estimates released today reflect the results of the comprehensive revision of the annual industry accounts for 1997-2012. The revision incorporates major changes in definitions, classifications, and statistical methods used to update the accounts to more accurately portray the evolving U.S. economy. Major changes introduced with this revision include:
- Updated industry and commodity definitions consistent with the 2007 North American Industry Classification System (NAICS).
- The results of the 2007 benchmark input-output (I-O) accounts, that incorporate U.S. Census Bureau data on shipments, receipts, and business expenses from the 2007 Economic Census, Business Expenses Supplement, and Service Annual Survey (SAS).
- The results of the 2013 comprehensive revision of the national income and product accounts, including the recognition of research and development (R&D) expenditures as capital, the capitalization of entertainment, literary, and other artistic originals, the expansion of the capitalization of the ownership transfer costs of residential fixed assets, and the use of an improved accrual accounting treatment of transactions for defined benefit pension plans.
- The incorporation of newly available and revised annual source data (e.g., Census’s Annual Survey of Manufactures and the Department of Treasury’s Statistics of Income).
- Expanded use of both Census Bureau SAS data for measuring gross output and BLS producer price indexes (PPIs) to deflate both output and intermediate inputs.
More detailed Annual Industry Accounts statistics are available on BEA’s interactive website https://apps.bea.gov/iTable/index.cfm. Additional information on this revision will be available in an article in the February 2014 issue of the Survey of Current Business.
BEA’s national, international, regional, and industry estimates; the Survey of Current Business; and BEA news releases are available without charge on BEA’s Web site at www.bea.gov. By visiting the site, you can also subscribe to receive free e-mail summaries of BEA releases and announcements.
* * *
Statistics of quarterly gross domestic product (GDP) by industry for 2005:Q1-2013:Q4 will be released on April 25, 2014 at 8:30 A.M. EDT.