
News Release
Gross Domestic Product by Industry, 4th quarter and annual 2013
The Bureau of Economic Analysis released today – for the first time – gross domestic product (GDP) by industry for 22 industry sectors on a quarterly basis. These new statistics fill an important gap in U.S. federal economic statistics by providing timely information on how individual industries contributed to U.S. economic growth in a given quarter. These new data also provide businesses with a comprehensive and consistent tool for assessing how their industries are faring compared to other industries. Policymakers, businesses, and academia will be able to use the statistics to quickly identify economic turning points, improving their ability to understand a given sector’s performance.
Quarterly GDP by industry statistics supplement other quarterly and monthly indicators of industries’ performance—such as employment, sales and shipments, profits, and prices—by providing a comprehensive and consistent picture of industries’ overall performance, allowing for a more complete analysis of business cycle dynamics and the sources of U.S. economic growth. These new statistics, which also include measures of gross output and of intermediate inputs by industry, are prepared within an integrated framework and are consistent with GDP and the final expenditure components published in BEA’s national income and product accounts. Quarterly GDP by industry statistics will be made available approximately 30 days after the release of the third estimate of GDP.
“Gross Domestic Product (GDP) is one of the U.S. government’s most valuable data resources,” said U.S. Secretary of Commerce Penny Pritzker. “American businesses will now have access on a quarterly basis to more comprehensive statistics about the impact of different industries on our economy. Enabling industries in all sectors to better measure their contributions to GDP and helping businesses understand and identify emerging trends more quickly make this new data an important tool for policy-makers at the local, state and national level. At the Department of Commerce, one of the top priorities of our ‘Open for Business Agenda’ is to provide data to help businesses and governments make the critical decisions that spur economic growth and job creation.”
Fourth Quarter 2013 GDP by industry
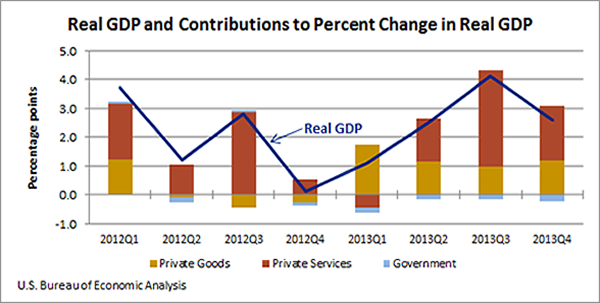
Real GDP increased 2.6 percent in the fourth quarter of 2013, with both the private goods- and services-producing sectors contributing to the increase. Overall, 15 out of 22 industry groups contributed to economic growth. The leading contributors to the increase were nondurable-goods manufacturing; professional, scientific and technical services; and wholesale trade.
- Nondurable-goods manufacturing real value added—a measure of an industry’s contribution to GDP—increased almost 19 percent in the fourth quarter after increasing 2.9 percent in the third quarter.
- Professional, scientific, and technical services increased 5.9 percent after increasing 8.3 percent in the third quarter.
- Wholesale trade increased 6.9 percent after increasing 7.3 percent in the third quarter.
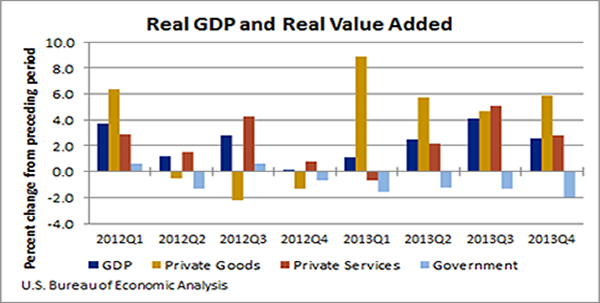
Growth in real GDP in the fourth quarter decelerated from 4.1 percent in the third to 2.6 percent in the fourth. The deceleration reflected a slowdown in the private services-producing sector and a larger decrease in the government sector that was partly offset by a pickup in growth in the goods-producing sector. Overall, 17 out of 22 industry groups contributed to the slowdown in real GDP growth; the leading contributors to the slowdown were real estate, rental, and leasing; construction; and retail trade.
2013 GDP by industry
Real GDP increased 1.9 percent in 2013 (that is, from the 2012 annual level to the 2013 annual level). Growth was widespread, with 19 of 22 industry groups contributing to the increase. Nondurable-goods manufacturing; real estate and rental and leasing; agriculture, forestry, fishing, and hunting; and health care and social assistance were the leading contributors to the economic growth.
- Manufacturing real value added rose 3.1 percent in 2013, after increasing 1.9 percent in 2012. Nondurable-goods manufacturing, the largest contributor to overall growth in the economy turned up, increasing 5.3 percent in 2013 after decreasing two consecutive years.
- The real estate and rental and leasing group increased 1.6 percent, marking the fourth consecutive increase for both real value added and real gross output.
- Agriculture, forestry, fishing, and hunting surged in 2013, increasing 16.4 percent after increasing 0.3 percent. The strong growth in 2013 reflects a weak 2012 that was affected by a severe Midwest drought.
Real GDP growth decelerated 0.9 percentage point in 2013, increasing 1.9 percent after increasing 2.8 percent. Mining, durable-goods manufacturing, and professional, scientific, and technical services were the leading contributors to the deceleration.
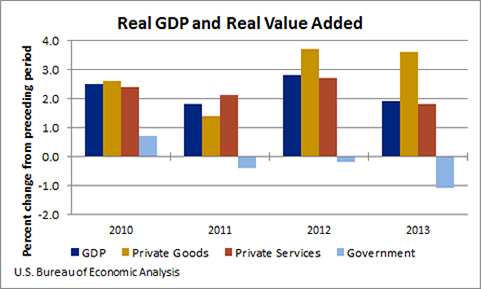
During 2013 (that is, measured from the fourth quarter of 2012 to the fourth quarter of 2013), real GDP increased 2.6 percent, after increasing 2.0 percent during 2012. Changes from fourth quarter to fourth quarter provide a picture of momentum in the economy during the year. Real value added for the private goods-producing sector increased 6.3 percent, compared with an increase of 0.6 percent during 2012. The private services-producing sector increased 2.4 percent during both 2012 and 2013. The government sector decreased 1.5 percent during 2013, compared with a decrease of 0.2 percent during 2012.
Relationship between Gross Output and Value Added
While many users focus on gross domestic product (GDP) by industry, gross output by industry is also a highly useful statistic that is published as part of BEA’s industry economic accounts. Gross output is principally a measure of an industry’s sales or receipts, which can include sales to final users in the economy (GDP) or sales to other industries (intermediate inputs). Gross output can also be measured as the sum of an industry’s value added and intermediate inputs. Value added (i.e. GDP) represents the sum of the costs-incurred and the incomes-earned in production, and consists of compensation of employees, taxes on production and imports, less subsidies, and gross operating surplus. Intermediate inputs refer to the value of both foreign and domestically produced goods and services which are used as energy, materials, and purchased services as part of an industry’s production process. Taken together, gross output, intermediate inputs, and value added by industry provide a comprehensive and consistent picture of each industry’s performance in the economy.
Because gross output reflects double-counting— both the sales of intermediate and final products—it is often referred to as “gross duplicated output.” In contrast, industry value added is defined as the value of the industry’s sales to other industries and to final users minus the value of its purchases from other industries. Thus, value added is a non-duplicative measure of production that when aggregated across all industries equals GDP. While gross output is a useful measure of individual industry’s output, gross output for the economy as a whole double-counts sales between industries and is not a good measure of aggregate business cycles or economic growth.
In the fourth quarter of 2013, real gross output for the private goods-producing sector increased 2.3 percent and it increased 6.2 percent for the private services-producing sector. Real gross output for the government sector decreased 3.6 percent.
NOTE. Quarterly estimates are expressed at seasonally adjusted annual rates, unless otherwise specified.
This news release is available on BEA’s Web site at www.bea.gov/newsreleases/rels.htm. The economic statistics are available at apps.bea.gov/iTable/index_industry_gdpIndy.cfm
* * *
Next release -- July 25, 2014 at 8:30 EDT for Gross Domestic Product by Industry: First Quarter 2014
BEA also publishes annual industry accounts that cover 69 industries. On January 23, 2014, BEA released the results of the 2014 comprehensive revision of the IEAs that covered the years 1997-2012.