
News Release
Gross Domestic Product by State, 2013 (advance estimate) and 1997-2012 (revised estimates)
Advance 2013 and Revised 1997—2012 Statistics of GDP by State
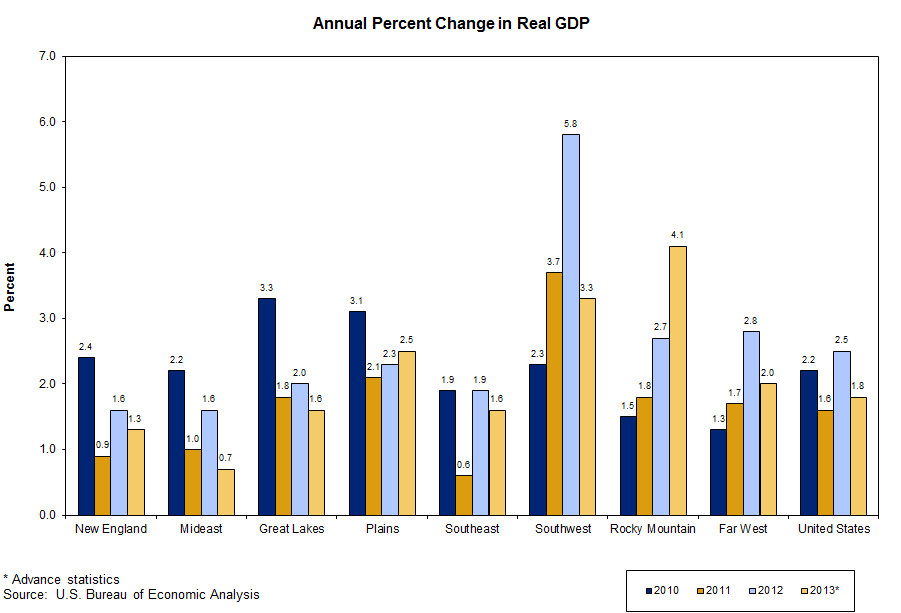
Real gross domestic product (GDP) increased in 49 states in 2013, according to new statistics released today by the Bureau of Economic Analysis (BEA).1 Nondurable–goods manufacturing; real estate and rental and leasing; and agriculture, forestry, fishing, and hunting were the leading contributors to real U.S. economic growth. U.S. real GDP growth slowed to 1.8 percent in 2013 after increasing 2.5 percent in 2012.2
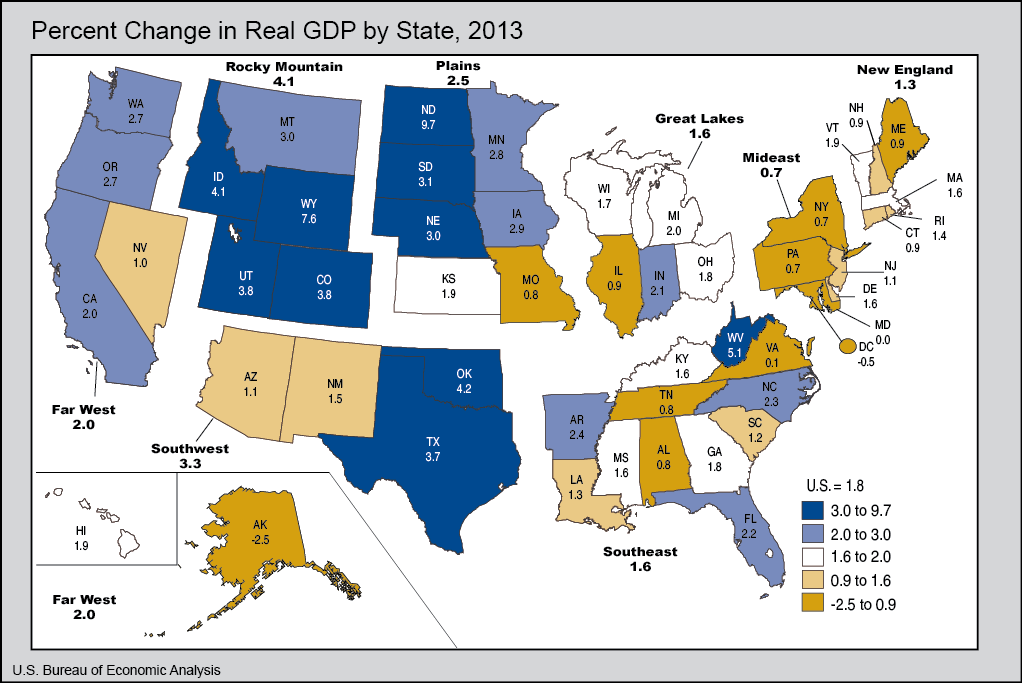
Real GDP increased in all eight BEA regions. Growth accelerated in the Rocky Mountain and Plains regions. The Rocky Mountain region grew the fastest, led by Wyoming, which increased 7.6 percent.
Nondurable–goods manufacturing was the largest contributor to U.S. real GDP by state growth in 2013. This industry increased 5.3 percent in 2013 after declining 0.5 percent in 2012. It was the leading contributor to growth in three of the eight BEA regions and in 10 states. Nondurable–goods manufacturing contributed 2.65 percentage points to growth in Louisiana and 1.19 percentage points to growth in Texas.
Real estate and rental and leasing was also a leading contributor to U.S. real GDP by state growth. This industry increased 1.6 percent in 2013, down slightly from 2.2 percent in 2012. It contributed to growth in all eight BEA regions and was the leading contributor to growth in the New England region. Real estate and rental and leasing contributed 0.50 percentage point or more to growth in North Dakota, Nevada, and Massachusetts.
Agriculture, forestry, fishing, and hunting contributed to real GDP growth in all eight BEA regions and in 49 states and the District of Columbia. It was the largest contributor to the growth of GDP in the Plains region. This industry contributed 1.36 percentage points or more to growth in North Dakota, South Dakota, Iowa, and Nebraska.
Comprehensive Revision of Gross Domestic Product by State. The statistics released today reflect the results of the comprehensive revision of gross domestic product (GDP) by state for 1997–2012. This revision not only incorporates new and revised source data, but it also includes significant improvements in classification and statistical methods to more accurately portray the state economies. Significant changes introduced with this revision include:
— Updated industry definitions consistent with the 2007 North American Industry Classification System (NAICS)
— Results of the 2013 comprehensive revision of state personal income
— Results of the 2013 comprehensive revision of the national income and product accounts and the 2014 comprehensive revision of the annual industry accounts, which included the recognition of research and development (R&D) expenditures as capital, the capitalization of entertainment, literary, and other artistic originals, the expansion of the capitalization of the ownership transfer costs of residential fixed assets, the use of an improved accrual accounting treatment of transactions for defined benefit pension plans, and improved methods for computing financial services provided by commercial banks
More detailed statistics of GDP by state are available on BEA's interactive website at /itable/index.cfm. Additional information on this revision will be available in an article in the July 2014 issue of the Survey of Current Business.
Although mining was not a significant contributor to real GDP growth for the nation, it did play a key role in several states. This industry was a large contributor in five of the fastest growing states: North Dakota, Wyoming, West Virginia, Oklahoma, and Colorado. In North Dakota, the fastest growing state in 2013, mining contributed 3.61 percentage points to the state's 9.7 percent growth in real GDP. By contrast, Alaska was the only state where real GDP decreased in 2013, primarily due to a decline in mining that resulted from lower output on the state's North Slope.
The government sector declined in six of the eight BEA regions, 39 states, and the District of Columbia, shaving 0.41 percentage point from growth in Georgia and Louisiana. A decline in the government sector was the primary factor for real GDP decreasing in 2013 in the District of Columbia, where the federal government accounts for nearly 32 percent of GDP.
Per capita real GDP by state in 2013. Per capita real GDP ranged from a high of $70,113 in Alaska to a low of $32,421 in Mississippi. Per capita real GDP for the U.S. was $49,115.
Tables 1–4 show these results in more detail; complete detail is available on BEA's Web site at www.bea.gov.
The next release of GDP by state is planned for the summer of 2015. The release will include revised statistics for 1997—2013 and advance statistics for 2014.
1Real GDP by state is an inflation–adjusted measure of each state's production based on national prices for those goods and services produced within each state. For a further description, see the "Explanatory Notes" section in this release.
2For an explanation of the small difference between real GDP by state and real GDP in the national income and product accounts (NIPAs), see the section "Relation of GDP by state to U.S. Gross Domestic Product."
Advance Statistics of GDP by State for 2013 by NAICS Sector
The advance statistics of GDP by state for 2013 are based on source data that are incomplete or subject to further revision by the source agency. Revised statistics, based on more complete data, will be released in the summer of 2015.
More information on the methodology used to produce the advance 2013 statistics, on the revised statistics of GDP by state for 1997—2012, and on revisions to the statistics of GDP by state will appear in an article in the July 2014 issue of the Survey of Current Business.
Explanatory Notes
Definitions. GDP by state is the state counterpart of the Nation's gross domestic product (GDP), the Bureau's featured and most comprehensive measure of U.S. economic activity. GDP by state is derived as the sum of the GDP originating in all the industries in a state.
The statistics of real GDP by state are prepared in chained (2009) dollars. Real GDP by state is an inflation–adjusted measure of each state's gross product that is based on national prices for the goods and services produced within that state. The statistics of real GDP by state and of quantity indexes with a reference year of 2009 were derived by applying national chain–type price indexes to the current–dollar values of GDP by state for the 64 detailed NAICS–based industries for 1997 forward.
The chain–type index formula that is used in the national accounts is then used to calculate the values of total real GDP by state and of real GDP by state at more aggregated industry levels. Real GDP by state may reflect a substantial volume of output that is sold to other states and countries. To the extent that a state's output is produced and sold in national markets at relatively uniform prices (or sold locally at national prices), real GDP by state captures the differences across states that reflect the relative differences in the mix of goods and services that the states produce. However, real GDP by state does not capture geographic differences in the prices of goods and services that are produced and sold locally.
Relation of GDP by state to U.S. Gross Domestic Product (GDP). An industry's GDP by state, or its value added, in practice, is calculated as the sum of incomes earned by labor and capital and the costs incurred in the production of goods and services. That is, it includes the wages and salaries that workers earn, the income earned by individual or joint entrepreneurs as well as by corporations, and business taxes such as sales, property, and Federal excise taxes—that count as a business expense.
GDP is calculated as the sum of what consumers, businesses, and government spend on final goods and services, plus investment and net foreign trade. In theory, incomes earned should equal what is spent, but due to different data sources, income earned, usually referred to as gross domestic income (GDI), does not always equal what is spent (GDP). The difference is referred to as the "statistical discrepancy."
Starting with the 2004 comprehensive revision, BEA's annual industry accounts and its accounts of GDP by state allocate the statistical discrepancy across all private–sector industries. Therefore, the statistics of GDP by state are now conceptually more similar to the GDP statistics in the national accounts than they had been in the past.
U.S. real GDP by state for the advance year, 2013, may differ from the Annual Industry Accounts' GDP by industry and, hence NIPA (National Income and Product Account) GDP, because of different sources and vintages of data used to estimate GDP by state and NIPA GDP. For the revised years of 1997—2012, U.S. GDP by state is nearly identical to GDP by industry except for small differences resulting from GDP by state' exclusion of overseas Federal military and civilian activity (because it cannot be attributed to a particular state). The statistics of GDP by industry are identical to those from the 2013 annual revision of the NIPAs, released in July 2013. However, because of revisions since July 2013, GDP in the NIPAs may differ from U.S. GDP by state.
BEA's national, international, regional, and industry statistics; the Survey of Current Business; and BEA news releases are available without charge on BEA's Web site at www.bea.gov. By visiting the site, you can also subscribe to receive free e–mail summaries of BEA releases and announcements.