
News Release
Personal Consumption Expenditures by State, 1997-2012 (prototype statistic)
Today, the U.S. Bureau of Economic Analysis released prototype estimates of personal consumption expenditures (PCE) for states for 1997-2012. These new estimates provide insight into household spending patterns across states that can be used together with other regional data to gain a better understanding of regional economies.
The data provide a new tool for state-level analysis of consumer activity and household economic well-being. The statistics can be used by state and regional policy makers for fiscal analysis and by businesses targeting regional markets. These prototype estimates are released for evaluation and comment by data users.
"For the first time, we now have rich data on consumer spending decisions in each state, giving us a snapshot of consumer confidence in our economy," said U.S. Secretary of Commerce Penny Pritzker. "The new report BEA released today will help businesses make smarter decisions about hiring and investing. Unleashing more of our data and making that data more accessible are key Commerce Department priorities, both of which will help strengthen U.S. economic growth, job creation and competitiveness."
"BEA's new data is a vivid example of how government innovation can benefit businesses and the American public – exactly what we want to showcase as part of the Commerce Department's 'Open for Business Agenda.' The creation of these new economic statistics makes clear how much consumers in each state are spending, as well as what they are buying, in a geographically detailed picture that didn't exist before," said Mark Doms, Under Secretary of Commerce for Economic Affairs.
The PCE-by-state estimates are released for 16 expenditure categories that correspond to the national level expenditure categories published by BEA. There are eight categories of goods, seven categories of services, and the net expenditures of nonprofit institutions serving households. The PCE-by-state estimates are reported in current dollars, and reflect variation in both prices and quantities.
Growth in Total Personal Consumption Expenditures by State. The prototype statistics show that total PCE rose in all states in 2012, but generally at a slower rate than in 2011. Growth was fastest in North Dakota at 11.5%, after growing 11.6% in 2011. PCE grew faster in 2012 compared with 2011 in Arizona, the District of Columbia, North Carolina, Nevada, and Utah.
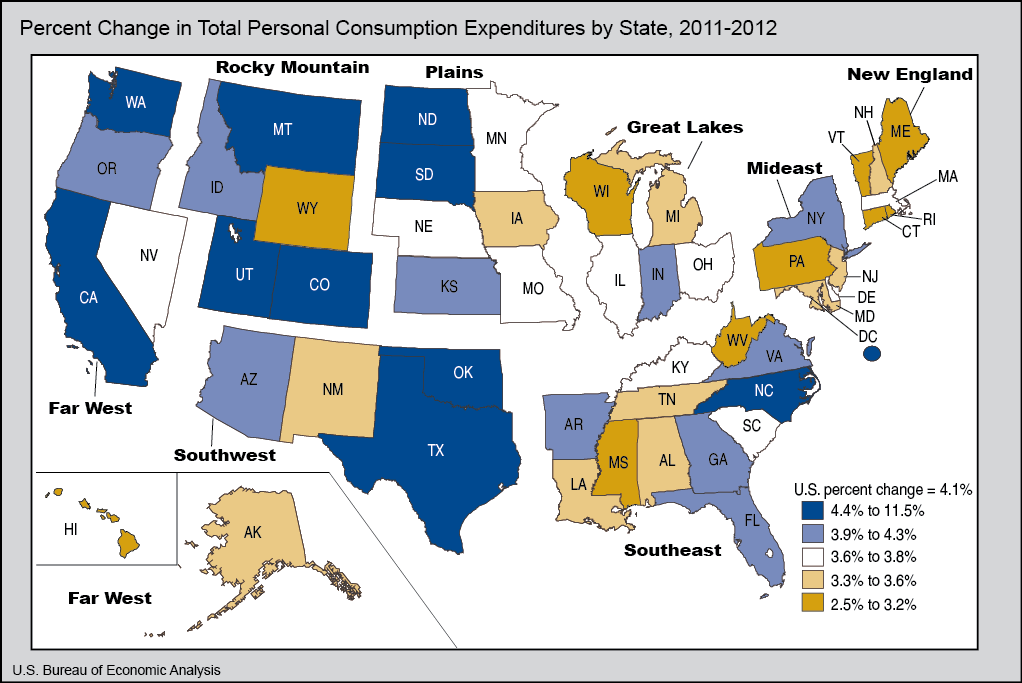
Other states with rapid total PCE growth in 2012 were Texas, the District of Columbia, and Utah. PCE rose at the slowest pace in 2012 in Mississippi. PCE growth in Arizona was closest to the average of all states of 4.1%. Growth in PCE by state reflects both population change and change in per capita expenditures.
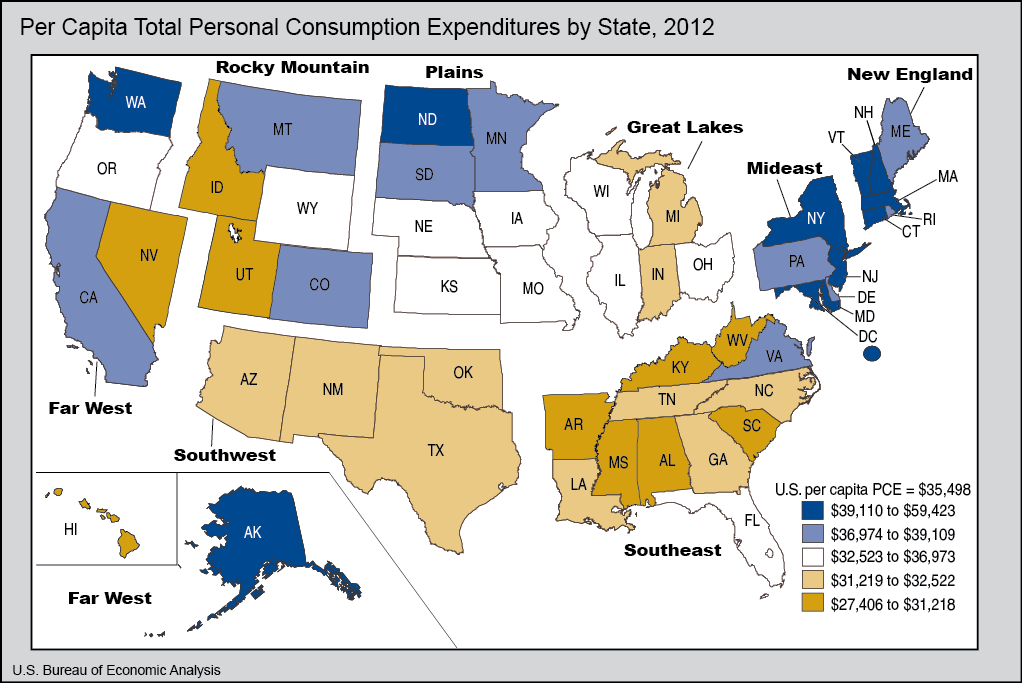
Per Capita Total Personal Consumption Expenditures. On a per capita basis, the prototype estimates show that the level of total PCE in 2012 ranged from a high of $59,423 in the District of Columbia to a low of $27,406 in Mississippi. Other states with relatively high per capita PCE were Massachusetts, Connecticut, and North Dakota. Across all states, per capita PCE was $35,498. States with per capita PCE closest to the average value were Oregon and Nebraska.
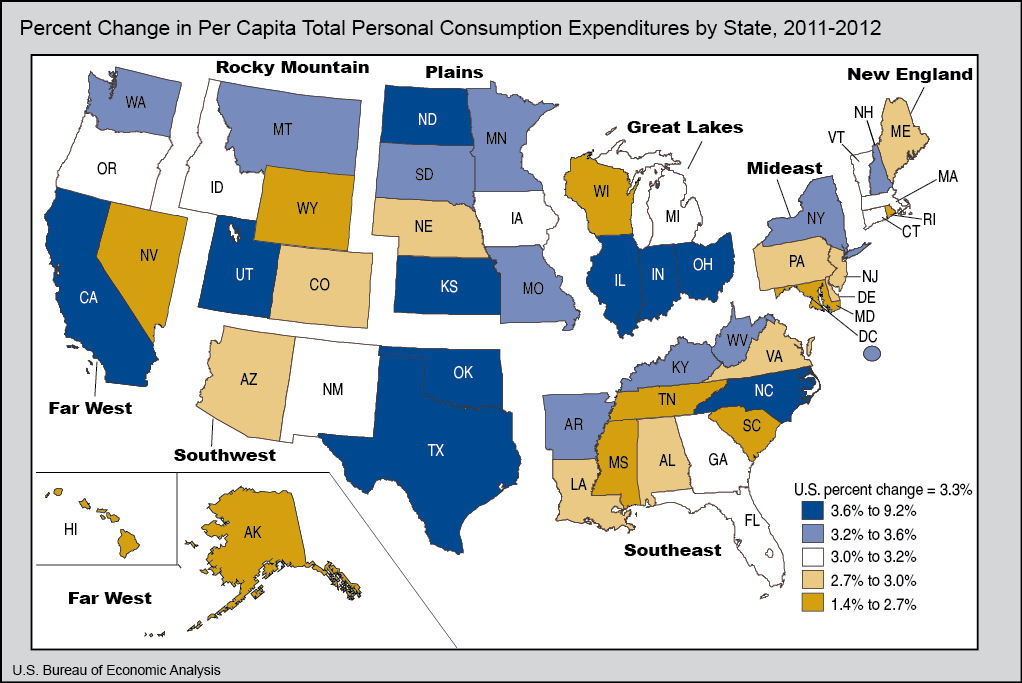
Growth in Total Per Capita Personal Consumption Expenditures. Growth in per capita total PCE between 2011 and 2012 ranged from a high of 9.2% in North Dakota to a low of 1.4% in Wyoming. Across all states, per capita PCE grew 3.3%. The states with the highest growth after North Dakota were Oklahoma, Texas, and Utah, where growth ranged between 4.0% and 4.2%. States with slowest growth after Wyoming were Hawaii, Mississippi, and Nevada.
Per Capita Personal Consumption Expenditures for Selected Categories. Per capita PCE for housing and utilities were highest in 2012 in the District of Columbia ($11,985), followed by Hawaii ($10,002), Connecticut ($9,524), and Maryland ($9,000). Per capita expenditures were lowest in Mississippi ($4,294), followed by Texas ($4,391), Arkansas ($4,500), and West Virginia ($4,536).
Per capita PCE for health care were highest in 2012 in the District of Columbia ($10,491), Massachusetts ($8,816), Alaska ($8,173), and North Dakota ($7,785). They were lowest in Nevada ($4,253), Utah ($4,311), Idaho ($4,695), and Georgia ($4,737).
Per capita PCE for food and beverages purchased for off-premises consumption were highest in 2012 in Alaska ($3,852), Vermont ($3,622), New Hampshire ($3,616), and Hawaii ($3,615). They were lowest in Oklahoma ($2,179), Arkansas ($2,243), Utah ($2,429), and Alabama ($2,445).
Per capita expenditures on gasoline and other energy goods were highest in 2012 in North Dakota ($3,916), Wyoming ($3,475), South Dakota ($2,521), and Maine ($2,373). Per capita expenditures were lowest in Hawaii ($882), New York ($919), Florida ($1,020), and California ($1,039).
Methodology. In summary, state-level data from the Economic Census and other sources are used to create an initial set of annual nominal expenditure estimates for 77 detailed spending categories. These initial estimates are balanced across states to match BEA's national PCE category totals and aggregated into the 16 categories presented in the prototype PCE-by-state statistics. The annual national PCE category totals are those released on July 31, 2013, which is prior to the July 30, 2014 annual revision of the NIPAs.
State-level Economic Census receipts are used for approximately 60% of PCE by state in Economic Census years. For other years, where state-level Economic Census receipts are not available, annual data from the Quarterly Census of Employment and Wages are used to interpolate and extrapolate expenditures. In these cases, the wages are those of the workers employed in the establishments within the state providing the goods and services to consumers.
For the remaining approximately 40% of PCE by state, other annual state-level data sources are used to estimate expenditures. These include the subcategories within housing and utilities and health care, as well as education services, food furnished to employees, railway transportation, air transportation, and net foreign travel.
The resulting estimates are then reviewed by category and state to identify spending by nonresidents. Nonresident spending is present in some of the initial estimates because the Economic Census source data are based on the location of the business collecting the receipts, rather than the residency of the consumer. This is apparent across many states for recreation services and transportation services. For a small number of states that have large numbers of nonresident visitors, nonresident spending is apparent in additional categories of spending.
For the prototype estimates of recreation services and transportation services, almost all states are adjusted to account for nonresident spending using a state-level ratio of survey-based household expenditures to business receipts. Adjustments are also made to a broader set of categories for visitor spending to Hawaii, Nevada, Florida, New York, and the District of Columbia.
Additional information on the statistics and the methodology can be found in the August 2013 issue of the Survey of Current Business, the monthly online journal of the Bureau of Economic Analysis, and in the upcoming article in the October 2014 issue of the Survey (/scb/index.htm).
Next Steps. BEA plans additional outreach with data users to assess these prototype statistics. Subject to data users' evaluations and comments, we plan to review the estimation methodology and continue to incorporate improved data sources. Provided that user evaluations are positive, we plan to release official statistics in 2015.
Availability of Data on BEA Website. Prototype statistics for each state for the 16 expenditure categories, plus additional maps for the expenditure categories described in this press release, may be found on BEA's Regional Accounts webpage Regional Accounts webpage.
Explanatory Notes. PCE by state is the state counterpart of the Nation's personal consumption expenditures (PCE). PCE represents the goods and services purchased by or on behalf of households, plus the purchases of nonprofit institutions serving households. For each state and for the District of Columbia, personal consumption expenditures are those expenditures made by or on behalf of residents. These expenditures include expenditures on activities outside of the state.
BEA's national, international, regional, and industry estimates; the Survey of Current Business; and BEA news releases are available without charge on BEA's Web site at www.bea.gov. By visiting the site, you can also subscribe to receive free e-mail summaries of BEA releases and announcements.