
News Release
Quarterly Gross Domestic Product by State, 2005-2013 (prototype statistic)
Today, the U.S. Bureau of Economic Analysis released prototype statistics of quarterly gross domestic product (GDP) by state for 2005–2013. These new statistics provide a more complete picture of economic growth across states that can be used with other regional data to gain a better understanding of regional economies as they evolve from quarter to quarter.
The new data provide a fuller description of the accelerations, decelerations, and turning points in economic growth at the state level, including key information about changes in the distribution of industrial infrastructure across states. These prototype statistics are released for evaluation and comment by data users.
"As 'America's Data Agency,' the Commerce Department is committed to making more of its rich data available in a more accessible way," said U.S. Secretary of Commerce Penny Pritzker. "The new regional economic statistics BEA released today provide more timely snapshots of each state's economic health. The report is just one example of how the Commerce Department is working to provide businesses, entrepreneurs, taxpayers, and policymakers with the latest economic intelligence to inform their decision making."
"You often hear about how the U.S. economy performed in a given quarter. Now you will be able to see how each state did. BEA's new regional data is timely, innovative and relevant – a trifecta in the Commerce Department's data development business," said Mark Doms, Under Secretary of Commerce for Economic Affairs.
The quarterly GDP by state statistics are released for 21 industry sectors and are released in both current dollars and inflation-adjusted chained (2009) dollars.
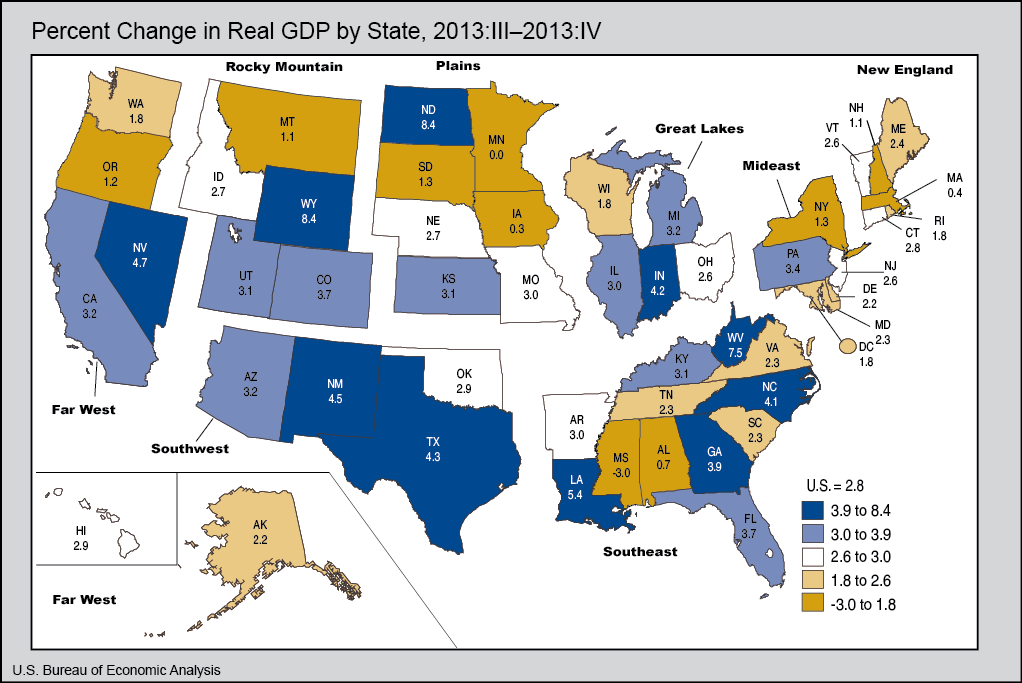
Percent Change in Quarterly Real GDP by State. U.S. real GDP by state increased 1.8 percent in 2013. Growth in real GDP accelerated in the second and third quarter of the year after increasing at an annual rate of 1.1 percent in the first quarter. After reaching a high of 4.2 percent in the third quarter, growth in real GDP decelerated to 2.8 percent in the fourth quarter. Real GDP grew steadily in 24 states through all four quarters in 2013. In the fourth quarter of 2013, real GDP increased in all states except Mississippi and Minnesota.
Nondurable-goods manufacturing was the largest contributor to U.S. real GDP by state growth in the fourth quarter of 2013. This industry increased 18.6 percent in the fourth quarter after moderate growth of 2.9 percent in the third quarter. Nondurable-goods manufacturing was the leading contributor to growth in 31 states in the fourth quarter, and it consistently led the growth in Louisiana, North Carolina, and Texas through the four quarters of 2013.
Professional, scientific, and technical services was the second largest contributor to U.S. real GDP growth in the third and fourth quarters of 2013. This industry increased 5.9 percent in the fourth quarter after growing 8.3 percent in the third quarter. It contributed to the growth in 49 states and the District of Columbia in the fourth quarter of 2013.
Wholesale trade contributed to real GDP growth in 48 states and the District of Columbia in the fourth quarter of 2013. This industry has consistently contributed more than 1.1 percentage points to growth in North Dakota since the second quarter of 2013.
Mining contributed only 0.27 percentage point to real GDP growth for the nation in the fourth quarter of 2013 despite growing 10.3 percent. It was, however, the most predominant contributor to growth in Alaska, Colorado, New Mexico, North Dakota, Oklahoma, West Virginia, and Wyoming. Mining contributed 8.62 percentage points to growth in North Dakota, 6.85 percentage points to growth in Wyoming, and 4.85 percentage points to growth in West Virginia.
The government sector declined 1.9 percent in the fourth quarter of 2013 and subtracted 0.24 percentage point from the growth in the nation. Declines in the government sector have subtracted from real GDP growth in the District of Columbia since the second quarter.
Construction subtracted from growth in 47 states and the District of Columbia in the fourth quarter of 2013. This industry declined 5.9 percent and subtracted 0.22 percentage point from growth in the nation. Mississippi was the only state with small positive contributions to growth from the construction sector in all four quarters.
Quarterly Gross Domestic Product (GDP) by State Methodology. Quarterly gross domestic product (GDP) by state is computed using data on annual GDP by state, national quarterly GDP by industry, and earnings by industry from state quarterly personal income (see explanatory notes on vintages). Initial current-dollar quarterly GDP by state estimates for each of 21 industry sectors are prepared using quarterly earnings by industry to interpolate quarterly changes in the annual GDP by state statistics. These initial estimates are then scaled to match the national quarterly GDP by industry statistics and then interpolated to the annual GDP by state statistics.
The statistics on quarterly real GDP by state are prepared in chained (2009) dollars. Real GDP by state is an inflation-adjusted measure of each state's gross product that is based on national prices for the goods and services produced within that state. The statistics of real GDP by state for the 21 industry sectors are derived by creating a set of quarterly implicit price deflators (IPD) that are consistent with the annual GDP by state IPDs and then applying these to the current-dollar quarterly GDP by state values. To create the quarterly IPDs by industry, the national quarterly chain-type price indexes are used to interpolate the annual GDP by state IPDs. Finally, total real GDP by state and real GDP by state for manufacturing and private industries are calculated using the Fisher chain-type price index formula.
Real GDP by state captures the differences across states that reflect the relative differences in the mix of goods and services that the states produce. However, real GDP by state does not capture geographic differences in the prices of goods and services that are produced and sold locally.
Next Steps. BEA plans additional outreach with data users to assess these prototype statistics. Subject to data users' evaluations and comments, we plan to review the estimation methodology and continue to incorporate improved data sources. Provided that user evaluations are positive, we plan to release official statistics in 2015.
Availability of Data on BEA Website. Prototype statistics of current-dollar and real GDP for each state and for the 21 industry sectors may be found on BEA's Regional Accounts webpage.
More information on the statistics and the methodology will appear in an article in an upcoming issue of the Survey of Current Business, the monthly online journal of the Bureau of Economic Analysis.
Explanatory Notes
Definitions. GDP by state is the state counterpart of the Nation's gross domestic product (GDP), the Bureau's featured and most comprehensive measure of U.S. economic activity. GDP by state is derived as the sum of the GDP originating in all the industries in a state.
Vintages. Quarterly GDP by state is consistent with the annual GDP by state released in June 2014 and the Annual Industry Accounts' quarterly GDP by industry released in April 2014. These statistics do not incorporate the July 2014 annual revision of the national income and product accounts.
Relation of GDP by State to U.S. Gross Domestic Product (GDP). An industry's GDP by state, or its value added, in practice, is calculated as the sum of incomes earned by labor and capital and the costs incurred in the production of goods and services. That is, it includes the wages and salaries that workers earn, the income earned by individual or joint entrepreneurs as well as by corporations, and business taxes such as sales, property, and Federal excise taxes--that count as a business expense.
GDP is calculated as the sum of what consumers, businesses, and government spend on final goods and services, plus investment and net foreign trade. In theory, incomes earned should equal what is spent, but due to different data sources, income earned, usually referred to as gross domestic income (GDI), does not always equal what is spent (GDP). The difference is referred to as the "statistical discrepancy."
Quarterly GDP by state for the U.S. differs from the GDP in the national income and product accounts (NIPAs) and thus from the Annual Industry Accounts' GDP by industry, because the U.S. GDP by state excludes federal military and civilian activity located overseas, which cannot be attributed to a particular state.
BEA's national, international, regional, and industry estimates; the Survey of Current Business; and BEA news releases are available without charge on BEA's Web site at www.bea.gov. By visiting the site, you can also subscribe to receive free e-mail summaries of BEA releases and announcements.