
News Release
U.S. International Investment Position, 2nd quarter 2014
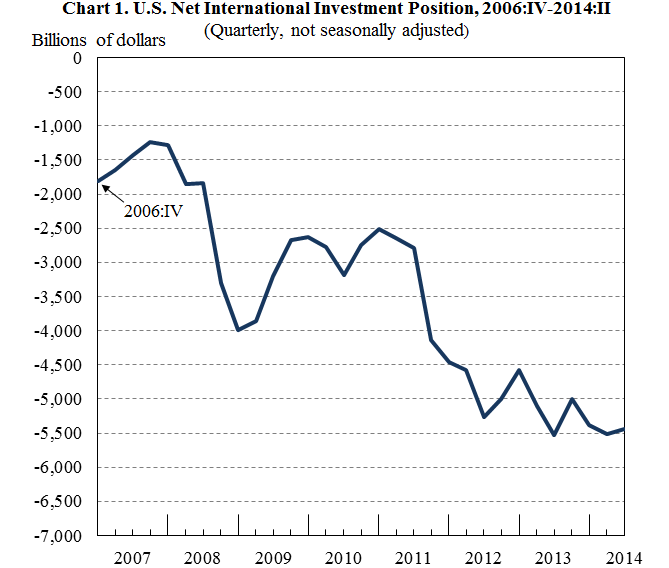
The U.S. net international investment position at the end of the second quarter of 2014 was -$5,445.1 billion (preliminary) as the value of U.S. liabilities exceeded the value of U.S. assets (chart 1, table 1). At the end of the first quarter of 2014, the net position was -$5,511.7 billion (revised). The $66.6 billion increase in the net position reflected a $913.2 billion increase in the value of U.S. assets and an $846.7 billion increase in the value of U.S. liabilities.
The U.S. net international investment position increased 1.2 percent in the second quarter, compared with a decrease of 2.4 percent in the first quarter and an average quarterly decrease of 7.4 percent from the first quarter of 2011 through the fourth quarter of 2013. The net position was equal to 2.7 percent of the value of all U.S. financial assets at the end of the second quarter, down from 2.8 percent at the end of the first quarter.1
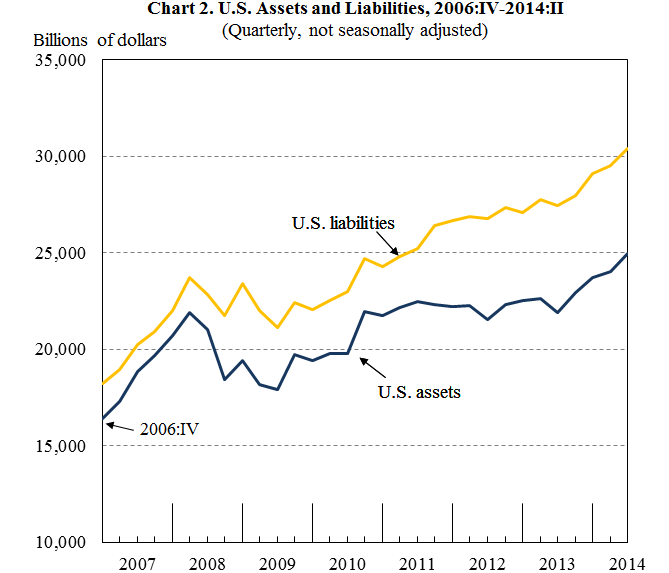
U.S. assets were $24,933.3 billion at the end of the second quarter compared with $24,020.1 billion at the end of the first quarter (chart 2). The $913.2 billion increase reflected an $882.2 billion increase in the value of assets excluding financial derivatives and a $31.1 billion increase in the value of financial derivatives.
U.S. assets excluding financial derivatives were $22,247.8 billion at the end of the second quarter compared with $21,365.7 billion at the end of the first quarter. The $882.2 billion increase reflected a $241.7 billion increase resulting from financial transactions and a $640.5 billion increase resulting from other changes in position.2 Other changes in position were mostly attributable to an increase in foreign stock prices that raised the value of U.S. portfolio investment assets, and to an increase in the market value of equity in direct investment.
U.S. liabilities were $30,378.4 billion at the end of the second quarter compared with $29,531.7 billion at the end of the first quarter (chart 2). The $846.7 billion increase reflected a $781.0 billion increase in the value of liabilities excluding financial derivatives and a $65.6 billion increase in the value of financial derivatives.
U.S. liabilities excluding financial derivatives were $27,728.2 billion at the end of the second quarter compared with $26,947.2 billion at the end of the first quarter. The $781.0 billion increase reflected a $248.4 billion increase resulting from financial transactions and a $532.7 billion increase resulting from other changes in position. Other changes in position were mostly attributable to an increase in U.S. stock prices that raised the value of foreign portfolio investment in the United States, and to an increase in the market value of equity in direct investment.
Revisions
The U.S. net international investment position at the end of the first quarter of 2014 was revised to -$5,511.7 billion from a previously-published value of -$5,539.3 billion. The $27.7 billion upward revision to the net position reflected a $418.6 billion upward revision to U.S. assets that exceeded a $390.9 billion upward revision to U.S. liabilities.
U.S. assets at the end of the first quarter were revised to $24,020.1 billion from $23,601.5 billion, and U.S. liabilities were revised to $29,531.7 billion from $29,140.8 billion. These revisions reflect revised source data from the Treasury International Capital (TIC) reporting system and from BEA’s quarterly surveys of direct investment.
NOTE: This news release is available on BEA’s Web site <www.bea.gov> along with Highlights related to this release, the latest detailed statistics for the U.S. international investment position, and a description of the estimation methods used to compile them. The second-quarter statistics in this release are preliminary and will be revised on December 30, 2014.
1 Board of Governors of the Federal Reserve System (FRS), “Table L.5 Total Liabilities and Its Relation to Total Financial Assets,” in Financial Accounts of the United States, Second Quarter 2014, Z.1. Statistical Release (Washington, DC: FRS, September 18, 2014): 11. According to the September release, at the end of the second quarter, the value of all U.S. financial assets was $198,250.1 billion. The value of U.S. assets abroad was $24,933.3 billion, or 12.6 percent of all U.S. assets, up from 12.3 percent at the end of the first quarter and down from the 14.1 percent series peak at the end of the first quarter of 2008.
2 For statistics on financial transactions, see the financial account in table 1.2 of the U.S. International Transactions Accounts. Quarterly financial transactions discussed in this release are not seasonally adjusted. Detail on other changes in position such as price changes, exchange-rate changes, and other changes in volume and valuation are available only for annual statistics.
Release dates in 2014
| End of the Fourth Quarter and Year 2013 | March 26, 2014 (Wednesday) |
| End of the First Quarter of 2014, Year 2013, and Annual Revisions | June 30, 2014 (Monday) |
| End of the Second Quarter of 2014 | September 25, 2014 (Thursday) |
| End of the Third Quarter of 2014 | December 30, 2014 (Tuesday) |
BEA’s national, international, regional, and industry statistics; the Survey of Current Business; and BEA news releases are available without charge at www.bea.gov. At the site, you can also subscribe to receive free e-mail summaries of BEA releases and announcements.