
News Release
U.S. International Investment Position, 3rd quarter 2014
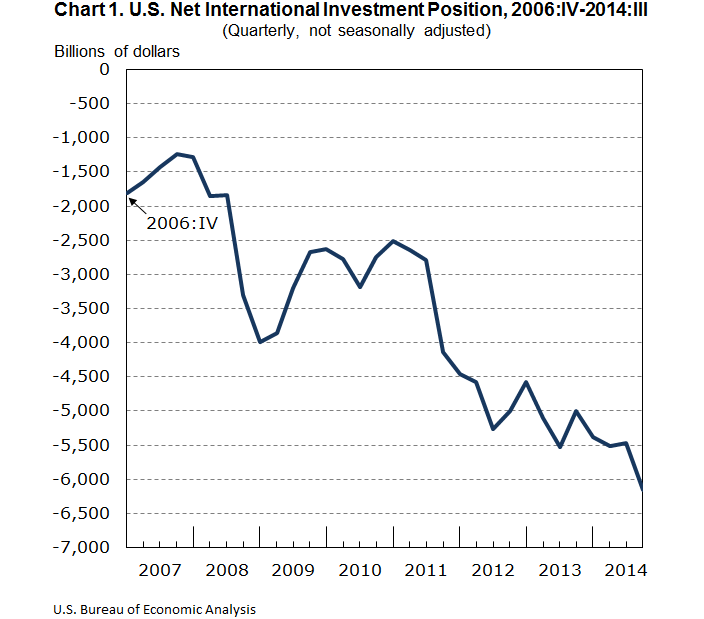
The U.S. net international investment position at the end of the third quarter of 2014 was -$6,157.9 billion (preliminary) as the value of U.S. liabilities exceeded the value of U.S. assets (chart 1, table 1). At the end of the second quarter of 2014, the net position was -$5,475.4 billion (revised). The $682.5 billion decrease in the net position reflected a $362.4 billion decrease in the value of U.S. assets and a $320.2 billion increase in the value of U.S. liabilities.
The U.S. net international investment position decreased 12.5 percent in the third quarter, compared with an increase of 0.7 percent in the second quarter and an average quarterly decrease of 7.0 percent from the first quarter of 2011 through the first quarter of 2014. The net position was equal to 3.1 percent of the value of all U.S. financial assets at the end of the third quarter, up from 2.8 percent at the end of the second quarter.1
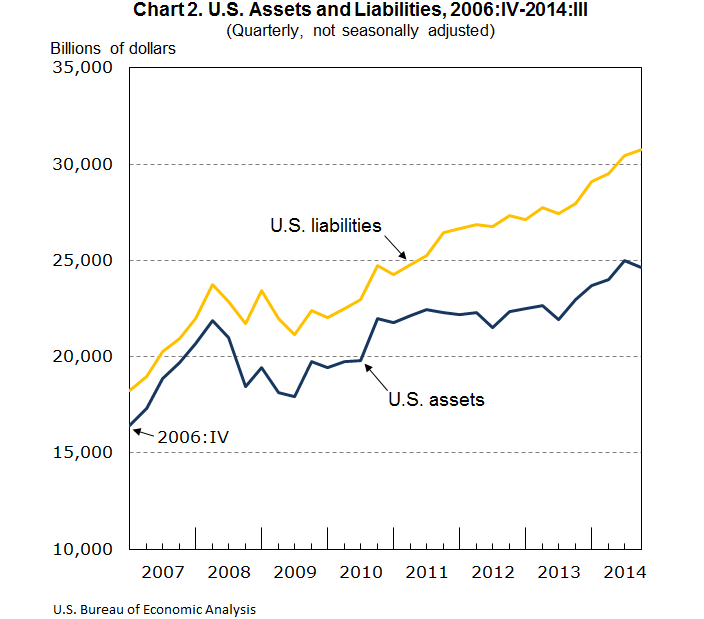
U.S. assets were $24,614.6 billion at the end of the third quarter compared with $24,977.0 billion at the end of the second quarter (chart 2). The $362.4 billion decrease reflected a $474.3 billion decrease in the value of assets excluding financial derivatives and a $112.0 billion increase in the value of financial derivatives.
U.S. assets excluding financial derivatives were $21,816.4 billion at the end of the third quarter compared with $22,290.7 billion at the end of the second quarter. The $474.3 billion decrease reflected an $841.2 billion decrease resulting from other changes in position that was partly offset by a $366.9 billion increase resulting from financial transactions.2 Other changes in position were mostly attributable to the depreciation of major foreign currencies against the U.S. dollar that lowered the value of U.S assets in dollar terms.3
U.S. liabilities were $30,772.5 billion at the end of the third quarter compared with $30,452.3 billion at the end of the second quarter (chart 2). The $320.2 billion increase reflected a $227.9 billion increase in the value of liabilities excluding financial derivatives and a $92.3 billion increase in the value of financial derivatives.
U.S. liabilities excluding financial derivatives were $28,028.5 billion at the end of the third quarter compared with $27,800.6 billion at the end of the second quarter. The $227.9 billion increase reflected a $358.0 billion increase resulting from financial transactions that was partly offset by a $130.1 billion decrease resulting from other changes in position. Other changes in position were mostly attributable to a decrease in the value of U.S. liabilities that were denominated in foreign currencies as a result of depreciation of major foreign currencies against the U.S. dollar, and to a lesser extent, decreases in U.S. bond prices.
Revisions
The U.S. net international investment position at the end of the second quarter of 2014 was revised to -$5,475.4 billion from the previously-published value of -$5,445.1 billion. The $30.3 billion downward revision to the net position reflected a $73.9 billion upward revision to U.S. liabilities that exceeded a $43.7 billion upward revision to U.S. assets.
U.S. assets at the end of the second quarter were revised to $24,977.0 billion from $24,933.3 billion; U.S. liabilities were revised to $30,452.3 billion from $30,378.4 billion. These revisions reflect revised source data from the Treasury International Capital (TIC) reporting system and from BEA's quarterly surveys of direct investment.
* * *
NOTE: This news release is available on BEA’s Web site <www.bea.gov> along with Highlights related to this release, the latest detailed statistics for the U.S. international investment position, and a description of the estimation methods used to compile them. The third-quarter statistics in this release are preliminary and will be revised on March 31, 2015.
1 Board of Governors of the Federal Reserve System (FRS), "Table L.5 Total Liabilities and Its Relation to Total Financial Assets," in Financial Accounts of the United States, Third Quarter 2014, Z.1. Statistical Release (Washington, DC: FRS, December 11, 2014): 11. According to the December release, at the end of the third quarter, the value of all U.S. financial assets was $198,456.4 billion. The value of U.S. assets abroad was $24,614.6 billion, or 12.4 percent of all U.S. assets, down from 12.6 percent at the end of the second quarter and down from the 14.1 percent series peak at the end of the first quarter of 2008.
2 For statistics on financial transactions, see the financial account in table 1.2 of the U.S. International Transactions Accounts. Quarterly financial transactions presented in this release are not seasonally adjusted. Detail on other changes in position such as price changes, exchange-rate changes, and other changes in volume and valuation is presented only for annual statistics.
3 According to the Federal Reserve Board's major currencies index, foreign currencies depreciated 7 percent against the U.S. dollar from the end of the second quarter to the end of the third quarter. The major currencies index is a weighted average of the foreign exchange values of the U.S. dollar against a subset of the broad index currencies that circulate widely outside the country of issue. See Foreign Exchange Rates—H10 (weekly release of daily data), Nominal Major Currencies Index at www.federalreserve.gov.
Release dates in 2015
| End of the Fourth Quarter and Year 2014 | March 31, 2015 (Tuesday) |
| End of the First Quarter of 2015, Year 2014, and Annual Revisions | June 30, 2015 (Tuesday) |
| End of the Second Quarter of 2015 | September 29, 2015 (Tuesday) |
| End of the Third Quarter of 2015 | December 29, 2015 (Tuesday) |
BEA’s national, international, regional, and industry statistics; the Survey of Current Business; and BEA news releases are available without charge at www.bea.gov. At the site, you can also subscribe to receive free e-mail summaries of BEA releases and announcements.