
News Release
Gross Domestic Product by Industry, 1st quarter, 2015
Nondurable Goods Manufacturing Led the Downturn in First Quarter
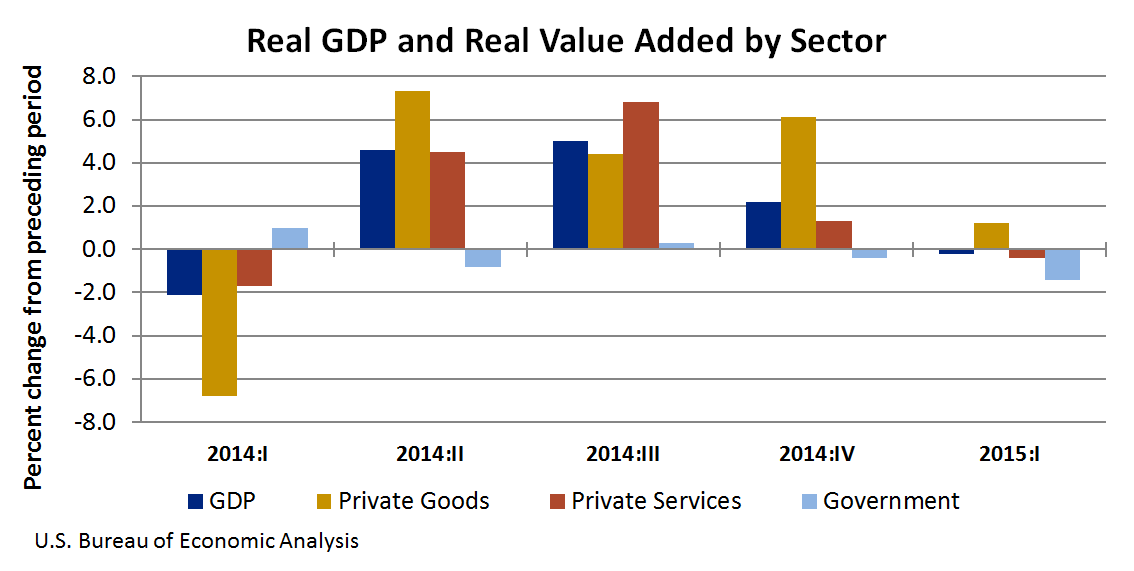
A deceleration in nondurable goods manufacturing and downturns in both professional, scientific, and technical services and wholesale trade were the leading contributors to the downturn in U.S. economic growth in the first quarter of 2015, according to statistics on the breakout of GDP by industry released today by the Bureau of Economic Analysis (BEA). Overall, 15 of 22 industry groups contributed to the downturn in the first quarter.
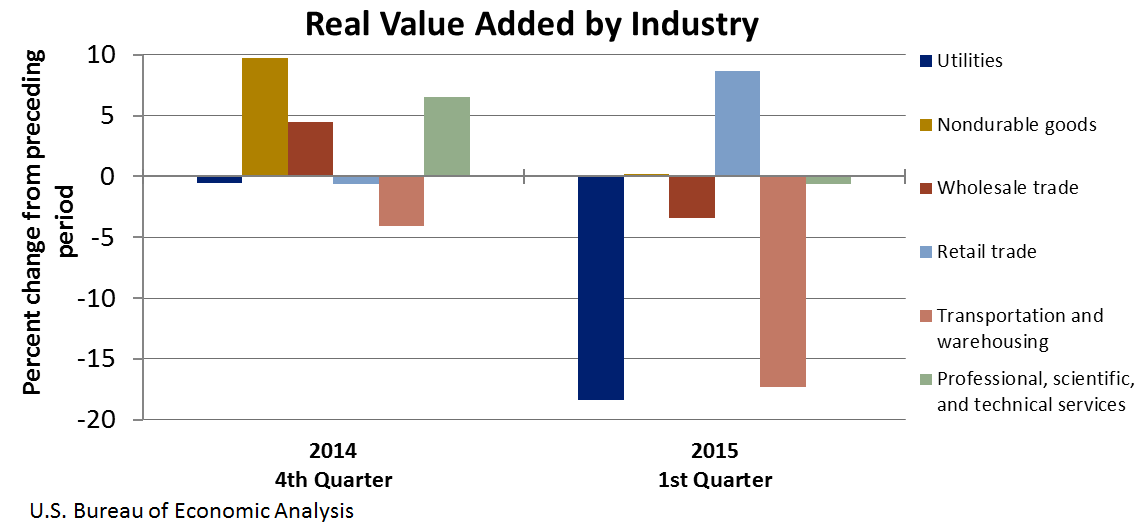
- Nondurable goods manufacturing real value added—a measure of an industry's contribution to GDP—decelerated significantly, increasing 0.2 percent in the first quarter, after a larger increase of 9.7 percent in the fourth quarter of 2014.
- Professional, scientific, and technical services decreased 0.6 percent, after increasing 6.5 percent. This was the first decrease after seven consecutive quarters of growth for the industry.
- Wholesale trade decreased 3.4 percent, after increasing 4.5 percent.
Other highlights
- Transportation and warehousing services decreased 17.3 percent, after decreasing 4.1 percent. This was the largest decrease since the first quarter of 2009.
- Utilities decreased 18.4 percent, after decreasing 0.5 percent in the fourth quarter. This was the largest decrease since the first quarter of 2014.
- Retail trade increased 8.7 percent, after decreasing 0.6 percent. The industry group contributed the largest positive offset to the decrease in real GDP in the first quarter.
Gross output by industry
Real gross output—a measure of an industry's sales or receipts, which includes sales to final users in the economy (GDP) and sales to other industries (intermediate inputs)—decelerated in the first quarter. This reflected a downturn in real gross output for the private services-producing sector that was partly offset by an acceleration in the private goods-producing sector and an upturn in the government sector.
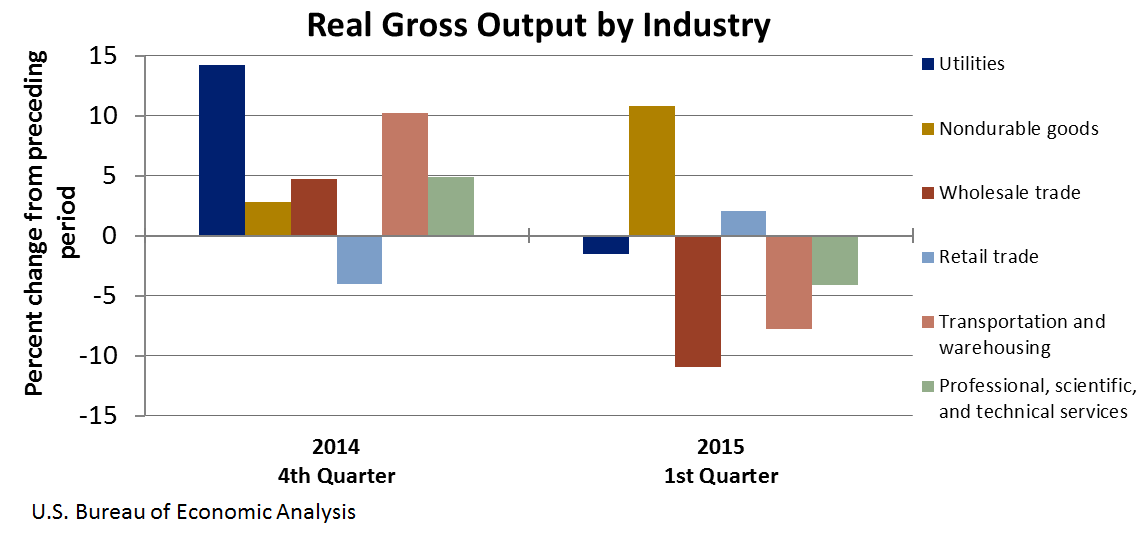
- Wholesale trade real gross output decreased 10.9 percent. This was the largest decrease since the second quarter of 2009.
- Transportation and warehousing services decreased 7.8 percent. This was the first decrease after seven consecutive quarters of growth.
- Professional, scientific, and technical services decreased 4.1 percent. This was the largest decrease since the third quarter of 2012.
Annual Revision of the Industry Economic Accounts
The annual revision of the industry economic accounts, covering the first quarter of 2012 through the first quarter of 2015, will be released along with the estimate of quarterly GDP by industry for the second quarter of 2015 on November 5th. All revisions will be fully consistent with the results of the annual revision of the national income and product accounts, which will be released on July 30th.
****
BEA's national, international, regional, and industry estimates; BEA news releases; and related articles in the Survey of Current Business are available for free on BEA's Web site at www.bea.gov. The entire historical time series for these estimates can be accessed in BEA's Interactive Data Application at www.bea.gov/itable/. Stay informed about BEA developments by signing up for our email subscription service or following us on Twitter @BEA_News. You also can access BEA data by registering for our Data Application Programming Interface, or API. (www.bea.gov/API/signup/index.cfm).
****
BEA's news release schedule is available at www.bea.gov/newsreleases/2015rd.htm
Next release -- November 5, 2015 at 8:30 A.M. EST for:
Gross Domestic Product by Industry: Second Quarter 2015
Annual Revision of the Industry Economic Accounts