
News Release
Gross Domestic Product by State, 2nd Quarter 2015
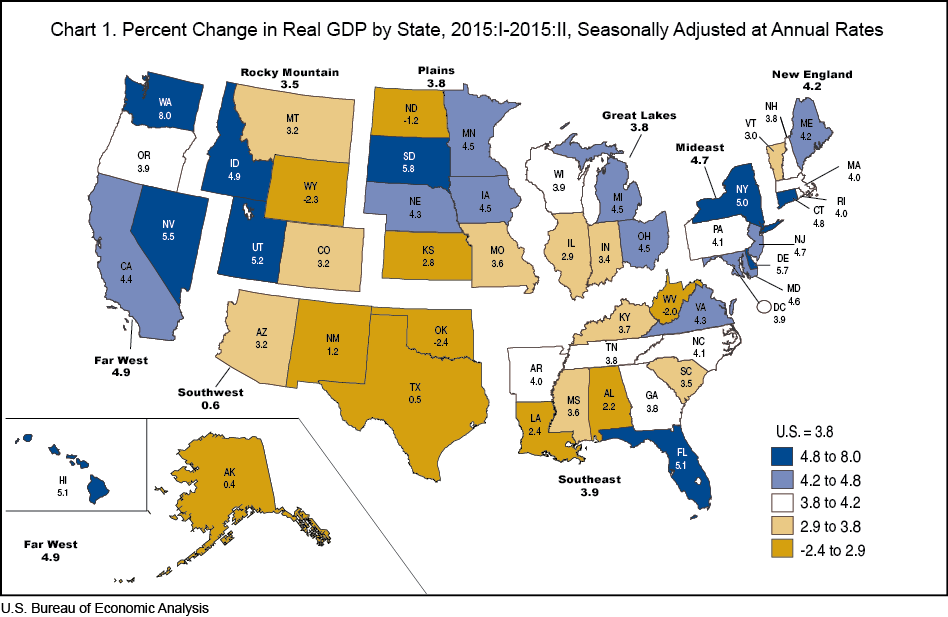
Second Quarter Growth in Service Industries Widespread Across States
Today, the U.S. Bureau of Economic Analysis (BEA) released–for the first time–gross domestic product (GDP) by state for 21 industry sectors on a quarterly basis.1 These new statistics supplement BEA's national quarterly GDP by industry statistics first released in April 2014. These new data provide timely information on how specific industries contribute to accelerations, decelerations, and turning points in economic growth at the state level, including key information about the impact of differences in industry composition across states.
As previously reported by BEA, growth in the service industries led real GDP growth for the nation in the second quarter of 2015.2,3 Today's report shows that second quarter growth in the service industries was widespread across states.
Real GDP increased in 46 states and the District of Columbia in the second quarter of 2015. Overall, U.S. real GDP by state grew at an annual rate of 3.8 percent in the second quarter of 2015 after increasing 0.7 percent in the first quarter of 2015. Finance and insurance; professional, scientific, and technical services; and wholesale trade were the leading contributors to real U.S. economic growth in the second quarter.
- Finance and insurance grew 12.4 percent in the second quarter of 2015. This industry was the leading contributor to growth in 28 states and contributed 3.32 percentage points to real GDP growth in Delaware, 2.42 percentage points to growth in South Dakota, and 2.16 percentage points to growth in New York.
- Professional, scientific, and technical services grew 7.6 percent in the second quarter of 2015. This industry contributed 0.52 percentage point to real GDP growth for the nation and contributed to growth in all 50 states and the District of Columbia. It was the leading contributor to growth in the District of Columbia, Virginia, and California.
- Wholesale trade grew 8.4 percent in the second quarter of 2015. This industry contributed 0.50 percentage point to real GDP growth for the nation and contributed to growth in all 50 states and the District of Columbia. It was the leading contributor to growth in Arkansas, Kentucky, and Indiana.
Other highlights
- Tranportation and warehousing increased 10.4 percent in the second quarter after a decline in the first quarter of 2015. This industry contributed to growth in 49 states and the District of Columbia. It contributed more than one percentage point to real GDP growth in Alaska and Nebraska.
- Construction increased 9.8 percent and contributed to real GDP growth in 48 states and the District of Columbia.
- Mining decreased 17.9 percent and subtracted from growth in 49 states in the second quarter of 2015. It subtracted more than two percentage points from real GDP growth in North Dakota, West Virginia, Oklahoma, Texas, and Wyoming.
Tables 1–2 show these results in more detail; complete detail is available on BEA's Web site at www.bea.gov.
The next quarterly GDP by state release is scheduled for March 2, 2016 and will cover the third quarter of 2015.
1Prototype quarterly GDP by state statistics for 2005–2014 were released on September 2, 2015 for evaluation and comment by data users.
2Service industries consist of utilities; wholesale trade; retail trade; transportation and warehousing; information; finance and insurance; real estate and rental and leasing; professional, scientific, and technical services; management of companies and enterprises; administrative and waste management services; educational services; health care and social assistance; arts, entertainment, and recreation; accommodation and food services; other services, except government; and government.
3See the November 5th Gross Domestic Product by Industry release at /newsreleases/industry/gdpindustry/2015/gdpind215.htm.
Revision of Gross Domestic Product by State. The quarterly statistics released today reflect the results of revisions to annual estimates of GDP by state. The annual estimates of current-dollar GDP by state were revised for 2007–2014 and estimates of real (inflation-adjusted) GDP by state were revised for 1997–2014. These revised statistics incorporate the following updates to other BEA statistics:
- Annual revision of the national income and product accounts released in July 2015.
- Annual revision of state personal income released in September 2015.
- Annual revision of GDP by industry released in November 2015.
More information on this revision and the new quarterly statistics will be available in an article in the January 2016 issue of the Survey of Current Business.
Explanatory Notes
Definitions. GDP by state is the state counterpart of the Nation's gross domestic product (GDP), the Bureau's featured and most comprehensive measure of U.S. economic activity. GDP by state is derived as the sum of the GDP originating in all the industries in a state.
The statistics of real GDP by state are prepared in chained (2009) dollars. Real GDP by state is an inflation-adjusted measure of each state's gross product that is based on national prices for the goods and services produced within that state. The statistics of real GDP by state and quantity indexes with a reference year of 2009 were derived by applying national chain-type price indexes to the current-dollar values of GDP by state for the 21 NAICS-based industry sectors for 2005 forward.
The chain-type index formula that is used in the national accounts is then used to calculate the values of total real GDP by state and real GDP by state at more aggregated industry levels. Real GDP by state may reflect a substantial volume of output that is sold to other states and countries. To the extent that a state's output is produced and sold in national markets at relatively uniform prices (or sold locally at national prices), real GDP by state captures the differences across states that reflect the relative differences in the mix of goods and services that the states produce. However, real GDP by state does not capture geographic differences in the prices of goods and services that are produced and sold locally.
Relation of GDP by State to U.S. Gross Domestic Product (GDP). An industry's GDP by state, or its value added, in practice, is calculated as the sum of incomes earned by labor and capital and the costs incurred in the production of goods and services. That is, it includes the wages and salaries that workers earn, the income earned by individual or joint entrepreneurs as well as by corporations, and business taxes such as sales, property, and Federal excise taxes—that count as a business expense.
GDP is calculated as the sum of what consumers, businesses, and government spend on final goods and services, plus investment and net foreign trade. In theory, incomes earned should equal what is spent, but due to different data sources, the measurement of income earned, usually referred to as gross domestic income (GDI), does not always equal the measurement of what is spent (GDP). The difference is referred to as the "statistical discrepancy."
GDP by state for the U.S. differs from the GDP in the national income and product accounts (NIPAs) and thus from the Annual Industry Accounts' GDP by industry, because the U.S. GDP by state excludes federal military and civilian activity located overseas, which cannot be attributed to a particular state.
BEA's national, international, regional, and industry estimates; the Survey of Current Business; and BEA news releases are available without charge on BEA's Web site at www.bea.gov. By visiting the site, you can also subscribe to receive free e-mail summaries of BEA releases and announcements.