
News Release
New Foreign Direct Investment in the United States, 2014
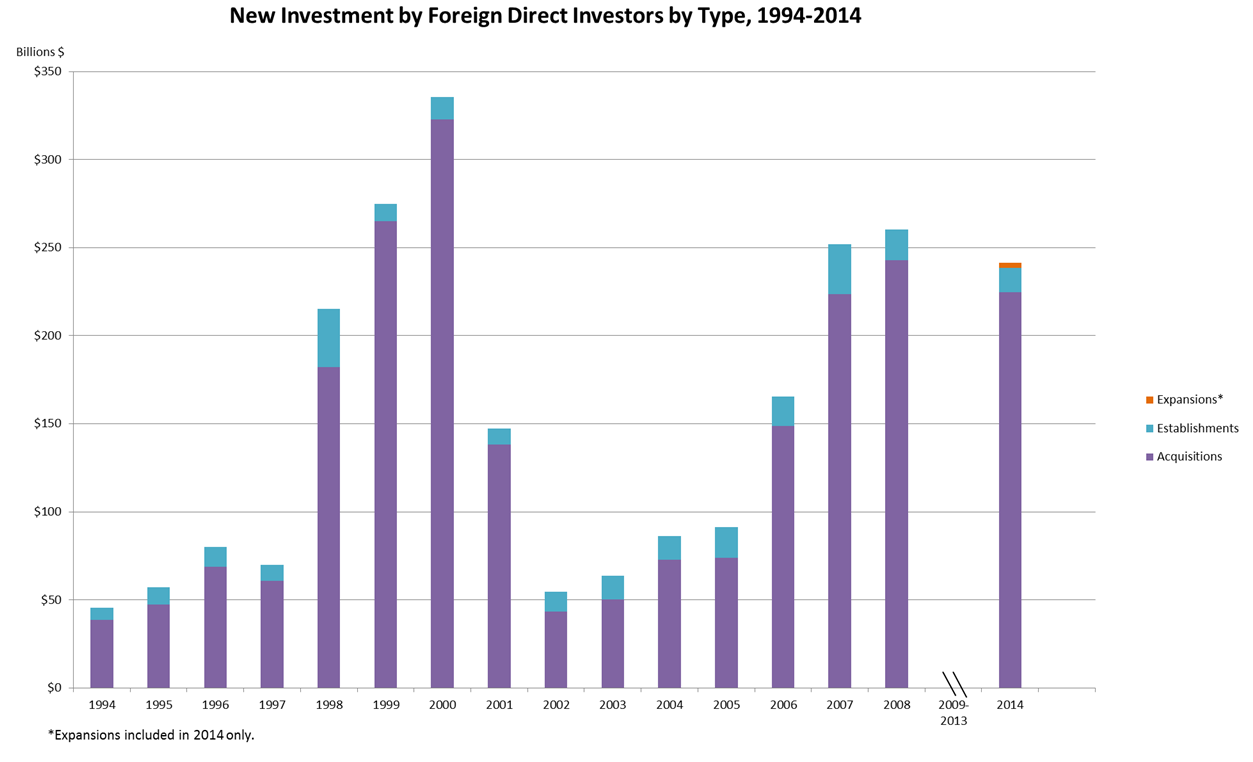
Expenditures by foreign direct investors for new investment—that is, to acquire, establish, or expand U.S. businesses—totaled $241.3 billion in 2014, according to the Bureau of Economic Analysis (BEA) in statistics released today. Acquisitions accounted for most of the investment.
Introduction to New Statistics
With today’s release, BEA for the first time is producing statistics on how much foreign direct investors are spending to acquire, establish, or expand U.S. businesses. These statistics are based on information collected by the new BE-13 survey, which reinstates and expands on the old BE-13 survey, which was discontinued after 2008. Data from the old survey were used to produce statistics on establishments and acquisitions, but not expansions.
State and national policymakers, as well as researchers, can draw on the statistics to assess the impact of foreign direct investment on the U.S. economy. Foreign entrepreneurs and others seeking to invest in the United States can use the new statistics to make more informed decisions. The BE-13 survey will also help ensure complete coverage of BEA’s other foreign direct investment statistics. The new statistics will be released each year. Data for 2015 and revised data for 2014 will be available in the summer of 2016.
Expenditures for acquisitions were $224.7 billion. Expenditures to establish new U.S. businesses totaled $13.8 billion, and expenditures to expand existing foreign-owned U.S. businesses totaled $2.8 billion. Planned total expenditures, which include both actual and planned future expenditures, totaled $263.9 billion in 2014. The portion of these expenditures provided by foreign direct investors rather than by their existing U.S. affiliates is included in BEA’s statistics on foreign direct investment transactions. These expenditures contribute to the foreign direct investment position in the United States, which represents the accumulated total value of foreign direct investment, totaling $2.9 trillion at yearend 2014. Similarly, only some of the transactions that contribute to the foreign direct investment position are included in the statistics on new investment expenditures. In particular, the new investment data exclude disinvestment flows and other transactions between foreign direct investors and their U.S. affiliates that do not fund the acquisition, establishment, or expansion of a U.S. business.
Expenditures by industry, country, and state in 2014
Total expenditures in manufacturing were $139.1 billion in 2014, the largest among major industries. Within the manufacturing sector, expenditures were largest in pharmaceuticals and medicines at $75.9 billion. Outside of manufacturing, expenditures were notable in publishing industries and in real estate.
By country of ultimate beneficial owner (UBO), the largest source country was Ireland, with first-year expenditures of $42.5 billion. Expenditures from Canada, Germany, and Japan were also notable. The largest source countries for new investment were most often countries that already have a large foreign direct investment presence in the United States. Of the eight largest countries by foreign direct investment position in the United States—Canada, France, Germany, Ireland, Japan, Netherlands, Switzerland, and the United Kingdom—seven were also among the top eight source countries for new investment.
By U.S. state, the largest expenditures, $48.9 billion, were for U.S. businesses in California. The four largest U.S. states in terms of expenditures by foreign direct investors—California, New Jersey, New York, and Texas—together received over half of all new investment. These four states accounted for 35 percent of private industry GDP in the United States in 2014.
Greenfield expenditures
In this release, BEA is presenting statistics on greenfield investments for the first time. Greenfield investment expenditures—expenditures to either establish a new U.S. business or to expand an existing foreign-owned U.S. business—totaled $16.6 billion in 2014. Total planned greenfield expenditures, which include both first-year expenditures and spending in other years, was $39.2 billion.
By U.S. industry, 2014 greenfield expenditures were largest in real estate, at $4.7 billion. In manufacturing, expenditures for 2014 greenfield investments were $2.8 billion and expenditures were particularly large in primary and fabricated metals and chemicals. By country of UBO, the largest source of first-year greenfield expenditures was Canada at $4.0 billion. Including expenditures from other years, the largest source countries for greenfield expenditures were China and Japan. By U.S. state, California and Texas attracted the largest expenditures for greenfield investments, with first-year expenditures of $3.2 and $2.7 billion respectively, and planned total expenditures of $7.7 billion for each state.
Additional Information
The statistics of new investments by foreign direct investors are based on data reported in the Survey of New Foreign Direct Investment in the United States (BE-13) conducted by the Bureau of Economic Analysis (BEA). The survey covers U.S. business enterprises that were acquired, established, or expanded by foreign direct investors. Information on the filing requirements for the survey may be found at www.bea.gov/surveys/respondent_be13.htm.
In the survey, a U.S. business enterprise is categorized as “acquired” if a foreign entity acquired a 10 percent or more voting interest in an incorporated U.S. business enterprise, or an equivalent interest of an unincorporated U.S. business enterprise, either directly or indirectly through an existing U.S. affiliate. (A U.S. affiliate is a foreign-owned U.S. business enterprise.) Acquisitions include instances where the acquired enterprise operates as a separate legal entity or where the acquired enterprise is merged into the operations of an existing U.S. affiliate. For the survey, a U.S. business enterprise is categorized as “established” if a foreign entity, or an existing U.S. affiliate of a foreign entity, established a new legal entity in the United States in which the foreign entity owns 10 percent or more of the new business enterprise’s voting interest, or an equivalent interest if unincorporated. An existing U.S. affiliate is categorized as “expanded” if it expands its operations to include a new facility where business is conducted and the expansion has a projected total cost of more than $3 million.
BEA reinstated the Survey of New Foreign Direct Investment in the United States in 2014 after ending the series after survey year 2008 due to budget cuts. The reinstated survey now includes expansions in an effort to better capture greenfield investments. Greenfield investment includes establishments of new companies by foreign investors and expansions of already existing companies. Because expansions were not included in the series that ended in 2008, the current series starting with 2014 and the previous series ending in 2008 are not directly comparable.
The statistics of new foreign direct investment include transactions resulting from corporate inversions. A corporate inversion occurs when a U.S. corporation that is currently the ultimate owner of its worldwide operations takes steps to become a wholly-owned subsidiary of a foreign corporation. A U.S. corporation can initiate an inversion either by creating a foreign corporation to be its new parent or by merging with an existing foreign corporation and ceding control. BEA’s direct investment surveys do not collect information on whether a U.S. corporation became foreign owned as a result of a corporate inversion, so these transactions cannot be separately identified in the statistics based on the survey data alone. BEA is exploring ways to identify inversions, such as adding inversion-related questions to its data collection instruments or using outside sources, so that users can identify the impact of these transactions on the statistics. The transactions associated with corporate inversions are also included in other BEA direct investment statistics. For additional information on how corporate inversions affect BEA’s economic accounts, see Jessica M. Hanson, Howard I. Krakower, Raymond J. Mataloni Jr., and Kate L.S. Pinard, “The Effects of Corporate Inversions on the International and National Economic Accounts” Survey of Current Business 95 (February 2015).
Holding companies established by foreign direct investors solely for the purpose of acquiring or establishing at least one other U.S. business enterprise are excluded from these statistics. A holding company is a company whose primary activity is holding the securities or financial assets of other companies. However, acquisitions or establishments that are undertaken by a foreign-owned U.S. holding company are included in the statistics. Holding companies are required to file the survey so that these entities can be added to the sample frames for BEA’s other surveys of foreign direct investment in the United States and so the foreign parent’s direct transactions with these companies can be included in the International Transactions Accounts and the International Investment Position Accounts. In addition, the statistics on new investments do not cover the acquisition of additional equity by a foreign parent in an existing U.S. affiliate, the acquisition of an existing U.S. affiliate by one foreign investor from another, or the expansion of the operations of an existing U.S. affiliate when no new facility where business is conducted is established. Sell-offs or other disinvestments are not subtracted from new investments.
The statistics on new foreign direct investment in the United States are classified by country of ultimate beneficial owner (UBO), by industry of the affiliate, and by state. For additional information on classifications by country of UBO or industry of affiliate please see the “Classification of Data” section of the “Methodology for the 2012 Benchmark Survey of Foreign Direct Investment in the United States.” Classification by country of UBO is used because the country that ultimately owns or controls a U.S. affiliate and therefore derives benefits from owning or controlling the affiliate generally is considered most important for analyzing these statistics. The UBO is the entity proceeding up a U.S. affiliate’s ownership chain, beginning with the foreign parent, which is not owned more than 50 percent by another entity. Classification by industry of affiliate means that each U.S. affiliate is classified in a single industry—the primary industry of the affiliate. As a result, any affiliate activities that take place in secondary industries are classified as activities in the primary industry. Classification by state indicates in which state the newly acquired, established, or expanded U.S. affiliate is located. If the newly acquired or established U.S. affiliate operates in more than one state, then the state where the greatest number of the employees were based was chosen. If there were no employees, then the state of incorporation was chosen.
In addition to the expenditures, the survey also collects data on the activities of the newly acquired, established, or expanded U.S. affiliate. These additional data include balance sheet and income statement items, specifically sales, net income, assets, liabilities, and total owner’s equity for the affiliate, as well as the number of employees of each U.S. affiliate. Values for 2014 for these additional items will be released in summer 2016 with the revised statistics for 2014 and preliminary statistics for 2015.
BEA’s national, international, regional, and industry statistics; the SURVEY OF CURRENT BUSINESS; and BEA news releases are available without charge on BEA’s Web site at www.bea.gov. At the site, you can also subscribe to receive free e-mail summaries of BEA releases and announcements.