
News Release
Personal Consumption Expenditures by State, 1997-2014
Today, the U.S. Bureau of Economic Analysis released its first set of official statistics on personal consumption expenditures (PCE) by state for 1997-20141. PCE by state – the measure of goods and services purchased by or on behalf of households by state of residence – provides insight into household spending patterns across states and can be used together with other regional data to gain a better understanding of regional economies.
PCE by state statistics are released for 16 expenditure categories; eight categories of goods, seven categories of services, and the net expenditures of nonprofit institutions serving households. The statistics are reported in current dollars and reflect variation in both prices and quantities.
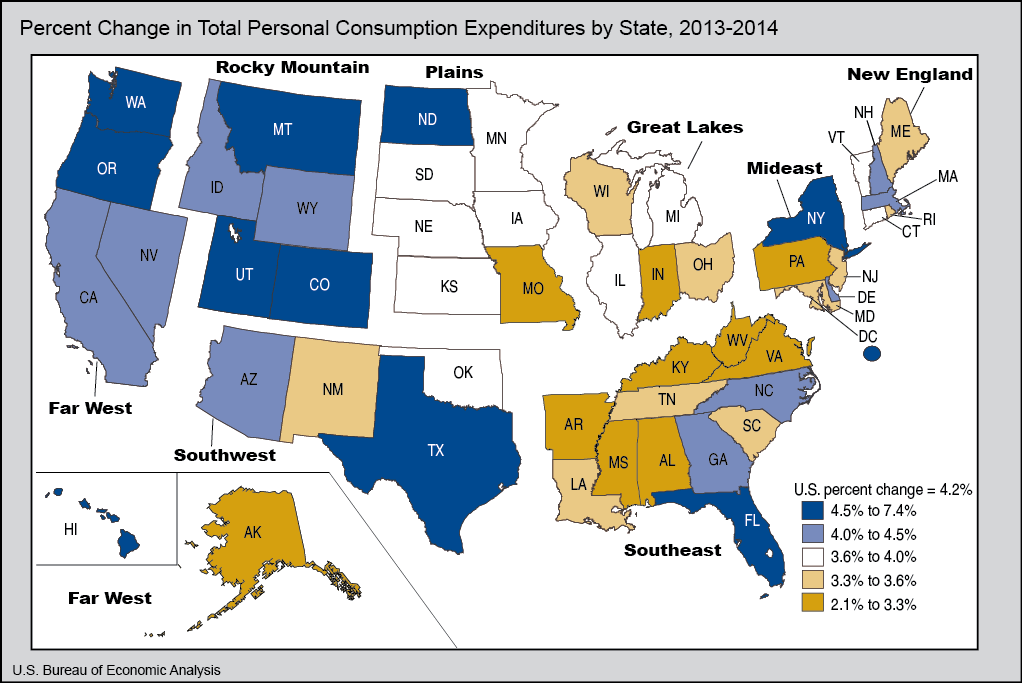
Growth in PCE by State. Across all states, the growth in total PCE by state accelerated to 4.2 percent in 2014 from 3.1 percent in 2013 (Table 1). This growth reflects the year-over-year change in current-dollar PCE by state. In 2014, growth in total PCE ranged from 2.1 percent in West Virginia to 7.4 percent in North Dakota, with more than 40 states growing faster than in 2013.
After North Dakota, the states with the highest growth in total PCE in 2014 were Colorado (5.7%) and Texas (5.7%). North Dakota and Texas were also among the fastest growing states in 2013. After West Virginia, the states with the slowest growth in total PCE in 2014 were Missouri (2.3%) and Kentucky (2.4%). Despite the relative slower growth in these states, their growth is an acceleration from 2013. In the District of Columbia, growth in total PCE was 5.1 percent in 2014, up from 4.2 percent in 2013.
In 2014, the largest contributors to the growth in total PCE across all states were housing and utilities and health care followed by other services and other nondurable goods. Each of these categories contributed 0.5 percentage point or more to the growth in total PCE and collectively accounted for about half of the growth in total PCE by state (Table 2). Food and beverages purchased for off-premises consumption, while a major component of total PCE by state, contributed little to growth in total PCE by state. Gasoline and other energy goods was the only category that subtracted from growth in total PCE by state.
Across all states, the expenditures on housing and utilities grew by 4.1 percent in 2014 (Table 3) and contributed on average 0.7 percentage point to the growth in total PCE. This growth was fastest in North Dakota (8.0%), the District of Columbia (6.3%), and Texas (5.6%). It was slowest in Vermont (1.4%), Delaware (1.8%), and Nevada (1.9%). In North Dakota and the District of Columbia, this category contributed 1.0 percentage point or more to the growth in total PCE.
Across all states, the expenditures on health care2 grew by 3.9 percent in 2014 and contributed on average 0.6 percentage point to the growth in total PCE. This growth was fastest in Delaware (7.5%), the District of Columbia (7.1%), and Hawaii (6.5%). It was slowest in Missouri (1.2%), Kentucky (1.5%), and Mississippi (1.5%). In Delaware and the District of Columbia, this category contributed 1.4 percentage points to the growth in total PCE.
Across all states, the expenditures on food and beverages for off-premises consumption grew by 2.4 percent in 2014 and contributed on average 0.2 percentage point to the growth in total PCE. This growth was fastest in the District of Columbia (6.9%), North Dakota (6.7%), and Vermont (4.9%). It was slowest in Missouri (0.2%), Minnesota (0.2%), and Mississippi (0.3%). In the District of Columbia and North Dakota, this category contributed 0.5 percentage point to the growth in total PCE.
Across all states, the expenditures on gasoline and other energy goods declined by 2.9 percent in 2014 and subtracted on average 0.1 percent from growth in total PCE. The largest declines were in Arkansas (-8.3%), Mississippi (-7.0%), and Hawaii (-6.7%). Despite the widespread decline, this category contributed to the growth in total PCE in North Dakota (0.4 percentage point) and Texas (0.1 percentage point), where expenditures grew by 4.4 percent and 1.8 percent, respectively.
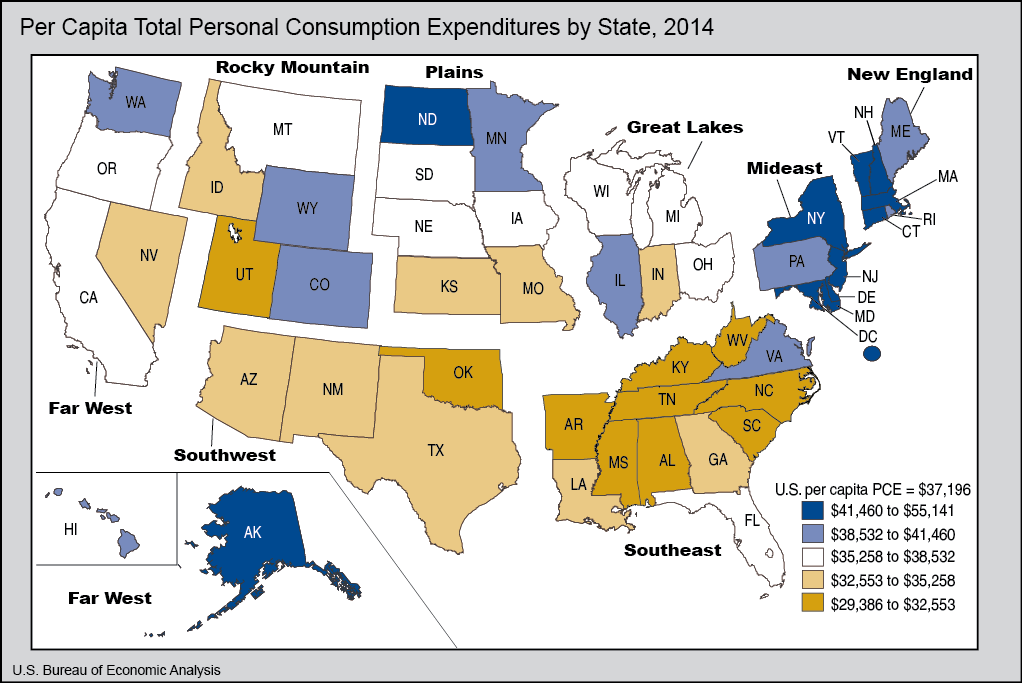
Per capita PCE by state in 2014. Per capita PCE by state reflects average PCE spending per person in a state. Across all states, per capita total PCE was $37,196 (Table 4). It ranged from a high of $48,020 in Massachusetts to a low of $29,386 in Mississippi.
After Massachusetts, the states with the highest per capita total PCE were North Dakota ($47,739), New Hampshire ($46,633), and Alaska ($46,229). After Mississippi, the states with the lowest per capita total PCE were Arkansas ($29,430), Alabama ($30,494), and Kentucky ($31,775). Per capita total PCE in the District of Columbia was $55,141.
Per capita PCE on housing and utilities across all states was $6,720 and ranged from a high of $9,146 in Maryland to a low of $4,391 in West Virginia. Other states with high per capita spending included New Jersey ($9,128), Connecticut ($8,948), and Hawaii ($8,882). Other states with low per capita spending included Arkansas ($4,581), Mississippi ($4,675), and Oklahoma ($4,854). Per capita spending in the District of Columbia was $9,775.
Per capita PCE on health care across all states was $6,128 and ranged from a high of $9,303 in Alaska to a low of $4,498 in Utah. Other states with high per capita spending included Massachusetts ($8,857), Delaware ($8,061), and Vermont ($7,473). Other states with low per capita spending included Idaho ($4,931), Nevada ($4,935), and Georgia ($4,979). Per capita spending in the District of Columbia was $11,358.
Per capita PCE on food and beverages purchased for off-premises consumption across all states was $2,780 and ranged from a high of $4,104 in Vermont to a low of $2,289 in Oklahoma. Other states with high per capita spending included Alaska ($3,924), Maine ($3,736), and New Hampshire ($3,635). Other states with low per capita spending included Arkansas ($2,351), Utah ($2,441), and Alabama ($2,461). Per capita spending in the District of Columbia was $3,889.
Per capita PCE on gasoline and other energy goods across all states was $1,258 and ranged from a high of $4,124 in North Dakota to a low of $710 in Hawaii. Other states with high per capita spending included Wyoming ($3,019), Maine ($2,203), and Vermont ($2,183). Other states with low per capita spending included New York ($862), Florida ($974), and California ($982). Per capita spending in the District of Columbia was $952.
Technical Note. State-level data from the Economic Census and other sources are used to create an initial set of annual nominal expenditure estimates for 77 detailed spending categories. These initial estimates are balanced across states to match BEA's national PCE category totals and aggregated into the 16 categories for publication.
State-level Economic Census receipts are used for approximately 60 percent of PCE by state in an Economic Census year. For intercensal years, the Economic Census receipts for each industry are interpolated and extrapolated using annual Quarterly Census of Employment and Wages industry wage and salary data of the workers employed in the establishments within the state providing the goods and services to consumers.
For the remaining approximately 40 percent of PCE by state, other annual state-level data sources are used to estimate expenditures. These include subcategories within housing and utilities and health care, as well as education services, food furnished to employees, railway transportation, air transportation, and net foreign travel.
The resulting estimates are then reviewed by category and state to identify spending by nonresidents. Nonresident spending is present in some of the initial estimates because the Economic Census source data is collected based on point of sale. This is apparent across many states for recreation services and transportation services. For a small number of states that have large numbers of nonresident visitors, nonresident spending is apparent in additional categories of spending.
For recreation services and transportation services, almost all states are adjusted to account for nonresident spending using a state-level ratio of survey-based household expenditures to business receipts. Adjustments are also made to a broader set of categories for visitor spending in Hawaii, Nevada, Florida, New York, and the District of Columbia.
Additional information on the statistics and the methodology can be found in the August 2013 and the September 2014 issue of the Survey of Current Business, the monthly online journal of the Bureau of Economic Analysis, and in the upcoming article in the December 2015 issue of the Survey (/scb/index.htm)
Availability of Data on BEA Website
PCE by state statistics for each state for the 16 expenditure categories, plus additional maps for the expenditure categories described in this press release, may be found on BEA's Regional Accounts webpage (/regional/index.htm).
The next release of PCE by state is scheduled for October 2016 and will include statistics for 2015.
1Prototype PCE by state statistics for 1997-2012 were released on August 7, 2014 for evaluation and comment by data users.
2Expenditures on health care do not include expenditures on health insurance services. Health insurance expenditures are part of the financial services and insurance category.
Explanatory Notes
Definitions. PCE by state is the state counterpart of the Nation's personal consumption expenditures (PCE). PCE by state measures the goods and services purchased by or on behalf of households and the net expenditures of nonprofit institutions serving households (NPISHs) by state of residence for the 50 states and the District of Columbia. PCE by state reflects spending on activities that are attributable to the residents of a state, even when those activities take place outside of the state.
In addition to out-of-pocket expenditures, PCE by state includes spending on behalf of resident households, such as expenditures for health care that are paid for by Medicare, Medicaid, and employer provided health insurance, and imputations for consumption of services without market transactions. The largest imputation in PCE by state is made to approximate the value of housing services provided by owner-occupied housing. This imputation ensures that the treatment of owner-occupied housing is comparable to that of tenant-occupied housing, which is valued by rent paid. Because homeowners consume the service of shelter whether or not they owe a mortgage, this imputation represents the rent that homeowners would pay if they rented the home that they own.
Relation of PCE by state to national PCE. The U.S. PCE by state differs slightly from the PCE in the national accounts because PCE by state excludes the net expenditures abroad by U.S. residents, which consist of government and private employees' expenditures abroad less personal remittances in kind to nonresidents. PCE by state, however, does include the travel expenditures abroad by U.S. residents.
BEA's national, international, regional, and industry estimates; the Survey of Current Business; and BEA news releases are available without charge on BEA's Web site at www.bea.gov. By visiting the site, you can also subscribe to receive free e-mail summaries of BEA releases and announcements.