
News Release
U.S. International Investment Position, 1st quarter 2015, Year 2014, and Annual Revisions
First Quarter of 2015
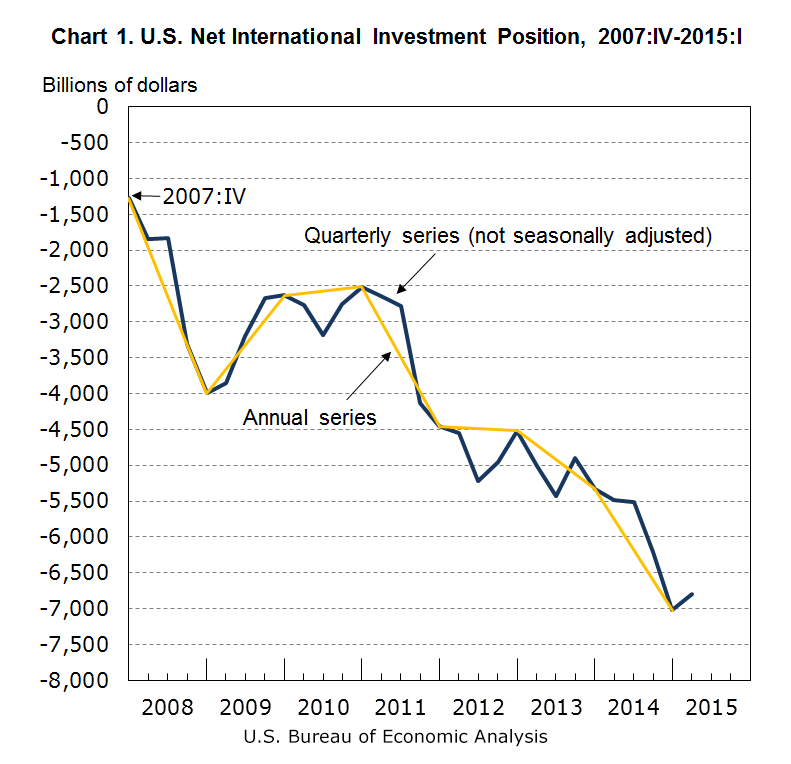
The U.S. net international investment position at the end of the first quarter of 2015 was -$6,794.0 billion (preliminary) as the value of U.S. liabilities exceeded the value of U.S. assets (chart 1, table 1). At the end of the fourth quarter of 2014, the net investment position was -$7,019.7 billion (revised).
Highlights for the first quarter of 2015
- The U.S. net international investment position increased $225.7 billion from the end of the fourth quarter of 2014 to the end of the first quarter of 2015, reflecting a $728.8 billion increase in the value of U.S. assets that exceeded a $503.1 billion increase in the value of U.S. liabilities.
- The $225.7 billion increase in the net investment position reflected net price changes, exchange-rate changes, and other changes in volume and valuation of $268.9 billion that were partly offset by net financial transactions of -$43.2 billion.
- The increase in the net investment position was mostly attributable to the increase in foreign equity prices that raised the value of U.S. direct and portfolio investment assets; these price increases were partly offset by the depreciation of major foreign currencies against the U.S. dollar that lowered the value of U.S. assets in dollar terms.
- The net investment position increased 3.2 percent in the first quarter, compared with a decrease of 13.1 percent in the fourth quarter and an average quarterly decrease of 6.9 percent from the first quarter of 2011 through the third quarter of 2014.
- The net investment position was equal to 3.3 percent of the value of all U.S. financial assets at the end of the first quarter, down from 3.5 percent at the end of the fourth quarter.1
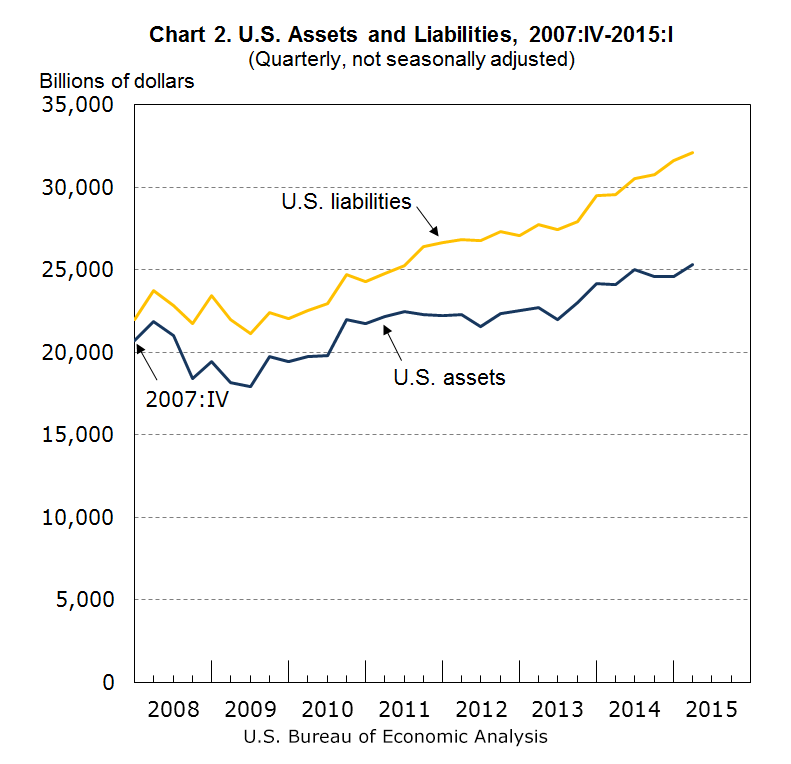
U.S. assets were $25,324.4 billion at the end of the first quarter compared with $24,595.5 billion at the end of the fourth quarter (chart 2). The $728.8 billion increase reflected a $577.0 billion increase in the value of assets excluding financial derivatives and a $151.9 billion increase in the value of financial derivatives.
U.S. assets excluding financial derivatives were $21,948.0 billion at the end of the first quarter compared with $21,371.0 billion at the end of the fourth quarter. The $577.0 billion increase reflected a $331.2 billion increase resulting from financial transactions and a $245.8 billion increase resulting from other changes in position.2 Other changes in position were mostly attributable to the increase in foreign equity prices that raised the value of U.S. direct and portfolio investment assets. These increases were partly offset by the depreciation of major foreign currencies against the U.S. dollar that lowered the value of U.S. assets in dollar terms.3
U.S. liabilities were $32,118.3 billion at the end of the first quarter compared with $31,615.2 billion at the end of the fourth quarter (chart 2). The $503.1 billion increase reflected a $356.1 billion increase in the value of liabilities excluding financial derivatives and a $146.9 billion increase in the value of financial derivatives.
U.S. liabilities excluding financial derivatives were $28,820.7 billion at the end of the first quarter compared with $28,464.6 billion at the end of the fourth quarter. The $356.1 billion increase reflected a $334.2 billion increase resulting from financial transactions and a $21.9 billion increase resulting from other changes in position. Other changes in position reflected increases in U.S. equity and bond prices that raised the value of U.S. portfolio investment liabilities. These increases were partly offset by decreases in the value of U.S. liabilities denominated in foreign currencies as the U.S. dollar continued to strengthen in the first quarter.
Year 2014
The U.S. net international investment position was -$7,019.7 billion (revised) at the end of 2014 compared with -$5,327.5 billion (revised) at the end of 2013 (table 2). The $1,692.2 billion decrease in the net investment position reflected a $2,128.6 billion increase in the value of U.S. liabilities that exceeded a $436.4 billion increase in the value of U.S. assets.
Highlights for the year 2014
- The $1,692.2 billion decrease in the net investment position was mostly attributable to net exchange-rate changes of -$1,206.4 billion as major foreign currencies depreciated against the U.S. dollar.
- Net financial transactions of -$239.6 billion and net price changes of -$353.6 billion also contributed to the decrease in the net investment position.
- The net investment position decreased 31.8 percent from the end of 2013 to the end of 2014, compared with a 17.9 percent decrease from the end of 2012 to the end of 2013.
- The net investment position was equal to 3.5 percent of the value of all U.S. financial assets at the end of 2014, up from 2.8 percent at the end of 2013.
Financial transactions
Net financial transactions of -$239.6 billion in 2014 resulted from net U.S. acquisition of assets, excluding financial derivatives, of $792.1 billion, less net U.S. incurrence of liabilities, excluding financial derivatives, of $977.4 billion, plus net transactions in financial derivatives of -$54.4 billion.
Net U.S. acquisition of assets excluding financial derivatives was $792.1 billion, up from $643.9 billion in 2013. In 2014, net acquisitions of portfolio and direct investment assets were partly offset by net sales of other investment and reserve assets.
Net U.S. incurrence of liabilities excluding financial derivatives was $977.4 billion, down from $1,042.0 billion in 2013. In 2014, net foreign purchases of U.S. equity and debt securities accounted for most of the incurrence of liabilities.
Price, exchange-rate, and changes in volume and valuation not included elsewhere (n.i.e.)
Other changes in the U.S. net international investment position for 2014 included -$1,206.4 billion in exchange-rate changes, -$353.6 billion in price changes, and $56.6 billion in changes in volume and valuation n.i.e.
Price changes led to a decrease of $353.6 billion in the net investment position, reflecting price appreciation of U.S. liabilities that exceeded price appreciation of U.S. assets.
Exchange-rate changes led to a decrease of $1,206.4 billion in the net investment position, reflecting the depreciation of major foreign currencies against the U.S. dollar. Exchange-rate changes lowered the dollar value of U.S. assets substantially more than the dollar value of U.S. liabilities denominated in foreign currencies.
Changes in volume and valuation n.i.e. led to an increase of $56.6 billion in the net investment position. These changes reflected the incorporation of newly available source data on aggregate holdings of long-term securities by U.S. and foreign residents from the Treasury International Capital reporting system (TIC), more complete TIC reporting of the nonbanking and banking data, capital gains and losses from the sale of direct investment assets, and other adjustments to source data. (See the Annual Revisions section for more information on the TIC source data.)
Investment positions at the end of 2014
U.S. assets were $24,595.5 billion at the end of 2014 compared with $24,159.1 billion at the end of 2013. The $436.4 billion increase reflected a $231.6 billion increase in the value of assets excluding financial derivatives and a $204.8 billion increase in the value of financial derivatives.
U.S. assets excluding financial derivatives were $21,371.0 billion at the end of 2014 compared with $21,139.4 billion at the end of 2013. The $231.6 billion increase reflected a $792.1 billion increase resulting from financial transactions that was partly offset by a $560.5 billion decrease resulting from other changes in position. Other changes in position were attributable to exchange-rate changes of -$1,308.4 billion that were partly offset by price changes of $725.1 billion and changes in volume and valuation n.i.e. of $22.8 billion.
Direct investment assets at market value were $7,124.0 billion at the end of 2014 compared with $7,117.3 billion at the end of 2013. The $6.8 billion increase reflected financial transactions of $357.2 billion, mostly from net equity investment attributable to reinvestment of earnings, and price changes of $102.8 billion. These increases were partly offset by exchange-rate changes of -$442.1 billion and changes in volume and valuation n.i.e. of -$11.1 billion.
Portfolio investment assets were $9,572.5 billion at the end of 2014 compared with $9,206.5 billion at the end of 2013. The $366.0 billion increase reflected 1) financial transactions of $538.1 billion, mostly from net U.S. purchases of foreign equity and investment fund shares, 2) price changes of $621.9 billion, mostly from increases in foreign equity prices, and 3) changes in volume and valuation n.i.e. of $34.8 billion. These increases were partly offset by exchange-rate changes of -$828.7 billion as major foreign currencies depreciated against the U.S. dollar.
Financial derivatives other than reserves held as assets (gross positive fair value) were $3,224.5 billion at the end of 2014 compared with $3,019.8 billion at the end of 2013.4 The $204.8 billion increase was mostly attributable to increases in the value of foreign exchange and single-currency interest rate contracts.
Other investment assets (currency and deposits, loans, insurance technical reserves, and trade credit and advances) were $4,240.2 billion at the end of 2014 compared with $4,367.3 billion at the end of 2013. The $127.1 billion decrease was mostly attributable to financial transactions of -$99.5 billion resulting from a reduction of deposits placed abroad. Exchange-rate changes of -$26.7 billion and changes in volume and valuation n.i.e. of -$0.9 billion also contributed to the decrease.
Reserve assets were $434.3 billion at the end of 2014 compared with $448.3 billion at the end of 2013. The $14.1 billion decrease was mostly attributable to exchange-rate changes of -$10.9 billion.
U.S. liabilities were $31,615.2 billion at the end of 2014 compared with $29,486.6 billion at the end of 2013. The $2,128.6 billion increase reflected a $1,920.3 billion increase in the value of liabilities excluding financial derivatives and a $208.3 billion increase in the value of financial derivatives.
U.S. liabilities excluding financial derivatives were $28,464.6 billion at the end of 2014 compared with $26,544.2 billion at the end of 2013. The $1,920.3 billion increase reflected a $977.4 billion increase resulting from financial transactions and a $942.9 billion increase resulting from other changes in position. Other changes in position reflected price changes of $1,078.7 billion as U.S. equity and bond prices increased. These increases were partly offset by exchange-rate changes of -$102.0 billion and changes in volume and valuation n.i.e. of -$33.8 billion.
Direct investment liabilities at market value were $6,228.8 billion at the end of 2014 compared with $5,780.6 billion at the end of 2013. The $448.2 billion increase reflected financial transactions of $131.8 billion and price changes of $342.1 billion. These increases were partly offset by changes in volume and valuation n.i.e. of -$25.7 billion.
Portfolio investment liabilities were $16,917.1 billion at the end of 2014 compared with $15,542.5 billion at the end of 2013. The $1,374.7 billion increase reflected financial transactions of $705.0 billion, mostly from net foreign purchases of U.S. debt securities, and price changes of $736.7 billion as U.S. equity and bond prices increased. These increases were partly offset by exchange-rate changes of -$60.7 billion and changes in volume and valuation n.i.e. of -$6.3 billion.
Financial derivatives other than reserves held as liabilities (gross negative fair value) were $3,150.7 billion at the end of 2014 compared with $2,942.4 billion at the end of 2013. The $208.3 billion increase was mostly attributable to increases in the value of foreign exchange and single-currency interest rate contracts.
Other investment liabilities (currency and deposits, loans, insurance technical reserves, trade credit and advances, and special drawing rights allocations) were $5,318.6 billion at the end of 2014 compared with $5,221.1 billion at the end of 2013. The $97.5 billion increase was more than accounted for by financial transactions of $140.6 billion that were partly offset by exchange-rate changes of -$41.3 billion and changes in volume and valuation n.i.e. of -$1.8 billion.
Annual Revisions
The U.S. net international investment position statistics released today have been revised from the first quarter of 2012 to the fourth quarter of 2014 to reflect newly available and revised source data primarily from BEA's surveys of direct investment and data from the Treasury International Capital (TIC) reporting system of the U.S. Department of the Treasury.
- Direct investment assets and liabilities are revised for 2012-2014 to incorporate newly available and revised data from BEA's quarterly and annual direct investment surveys.
- Portfolio investment assets and liabilities are revised for 2012-2014 to incorporate newly available and revised data from these (TIC) surveys: Aggregate Holdings of Long-Term Securities by U.S. and Foreign Residents (SLT), Foreign-residents' Holdings of U.S. Securities, including Selected Money Market Instruments (SHL), and Report of U.S. Ownership of Foreign Securities, including Selected Money Market Instruments (SHCA).
- Other investment assets and liabilities are revised for 2012-2014 to incorporate revisions from several sources.
- Newly available and revised data from these TIC surveys: Reports by Financial Institutions of Liabilities to, and Claims on, Foreign Residents by U.S. Residents (BC, BL-1, BL-2 BQ-1, and BQ-2), covering debt claims and liabilities excluding long- term debt securities; and Reports of Liabilities to, and Claims on, Unaffiliated Foreign Residents by U.S. Resident Non-Financial Institutions (CQ-1 and CQ-2), covering debt claims and liabilities excluding long-term debt securities.
- Revisions for 2012-2014 also incorporate newly available and revised U.S. government administrative data.
- Revisions for 2012-2013 incorporate newly available and revised data on transactions of U.S. financial intermediaries with foreign financial intermediaries from BEA's quarterly and annual direct investment surveys that are recorded in other investment.
- Financial derivatives are revised for 2013 and 2014 to incorporate newly available and revised data from the TIC survey Report of Holdings of, and Transactions in, Financial Derivatives Contracts with Foreign Residents (D).
The quarterly U.S. net international investment positions are revised upward an average of 1.0 percent for 2012 and 1.7 percent for 2013, and downward an average of 0.8 percent for 2014.
On a yearend basis, the net investment position is revised upward by 1.3 percent for 2012 and 1.0 percent for 2013, and downward by 1.5 percent for 2014.
- U.S. assets are revised upward by $41.6 billion for 2012 and $449.3 billion for 2013, and downward by $97.7 billion for 2014 (table 3).
- U.S. liabilities are revised downward by $18.8 billion for 2012, and upward by $393.8 billion for 2013 and $6.8 billion for 2014.
- Revisions to other investment assets and liabilities at the end of 2013 reflect an increase in the panel reporting on the TIC B-forms that improved the coverage of loans and deposits.5 The increase in the panel is also reflected in changes in volume and valuation n.i.e. in 2013.
- Revisions to financial derivatives assets and liabilities at the end of 2013 reflect an increase in the panel reporting on the TIC D-form.
- Revisions to other investment and financial derivatives are similar in size for both assets and liabilities; they do not have large effects on the net investment position.
The July SURVEY OF CURRENT BUSINESS will contain an article with a more detailed discussion of the international investment position statistics for the first quarter of 2015, annual statistics for 2014, and revised historical data. The July issue will also contain an article about direct investment positions valued at historical-cost and revised historical data on direct investment with detail by country and industry.
****
NOTE: This news release is available on BEA's Web site (www.bea.gov) along with Quarterly Highlights and Annual Highlights related to this release, the latest detailed statistics for the U.S. international investment position, and a description of the estimation methods used to compile them. The first-quarter statistics in this release are preliminary and will be revised on September 29, 2015.
1 Board of Governors of the Federal Reserve System (FRS), "Table L.5 Total Liabilities and Its Relation to Total Financial Assets," in Financial Accounts of the United States, First Quarter 2015, Z.1. Statistical Release (Washington, DC: FRS, June 11, 2015):11. According to the June release, at the end of the first quarter, the value of all U.S. financial assets was $205,023.8 billion. The value of U.S. assets abroad was $25,324.4 billion, or 12.4 percent of all U.S. assets, up from 12.1 percent at the end of the fourth quarter and down from the 14.1 percent series peak at the end of the first quarter of 2008.
2 For statistics on financial transactions, see the financial account in table 1.2 of the U.S. International Transactions Accounts. Quarterly financial transactions presented in this release are not seasonally adjusted. Detail on other changes in position such as price changes, exchange-rate changes, and other changes in volume and valuation is presented only for annual statistics.
3 According to the Federal Reserve Board's major currencies index, foreign currencies depreciated 7.5 percent against the U.S. dollar from the end of the fourth quarter of 2014 to the end of the first quarter of 2015; from the end of the year 2013 to the end of the year 2014, foreign currencies depreciated 10.5 percent. The major currencies index is a weighted average of the foreign exchange values of the U.S. dollar against a subset of the broad index currencies that circulate widely outside the country of issue. See Foreign Exchange Rates— H10 (weekly release of daily data), Nominal Major Currencies Index at www.federalreserve.gov.
4 A derivatives contract with a positive fair value represents the amount that a foreign resident would have to pay to a U.S. counterparty if the contract were terminated or settled. A contract with a negative fair value represents the amount that a U.S. resident would have to pay to a foreign counterparty if the contract were terminated or settled. The gross positive (negative) fair value is the sum of all contracts with positive (negative) fair values. Fair values differ from notional values, which are the underlying amounts used to calculate payments on contracts.
5 For additional information on the 2013 series break in the TIC B-forms, see www.treasury.gov/resource-center/data-chart-center/tic/Pages/ticliab.aspx.
Release dates in 2015
| End of the Fourth Quarter and Year 2014 | March 31, 2015 (Tuesday) |
| End of the First Quarter of 2015, Year 2014, and Annual Revisions | June 30, 2015 (Tuesday) |
| End of the Second Quarter of 2015 | September 29, 2015 (Tuesday) |
| End of the Third Quarter of 2015 | December 29, 2015 (Tuesday) |
BEA statistics—including GDP, personal income, the balance of payments, foreign direct investment, the input-output accounts, and economic statistics for states, local areas, and industries—are available on the BEA Web site: www.bea.gov. E-mail alerts are also available.