
News Release
Gross Domestic Product by Industry, 4th quarter and annual 2015
Information Services Led Growth in the Fourth Quarter
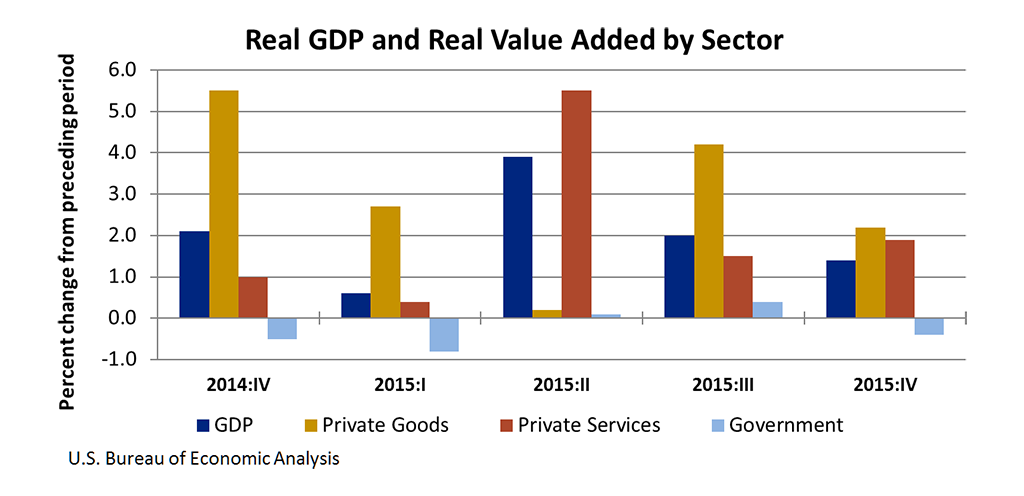
Information; construction; and professional, scientific, and technical services were the leading contributors to the increase in U.S. economic growth in the fourth quarter of 2015. According to statistics on the breakout of gross domestic product (GDP) by industry released today by the Bureau of Economic Analysis (BEA), overall, 16 of 22 industry groups contributed to the 1.4 percent increase in real GDP in the fourth quarter.
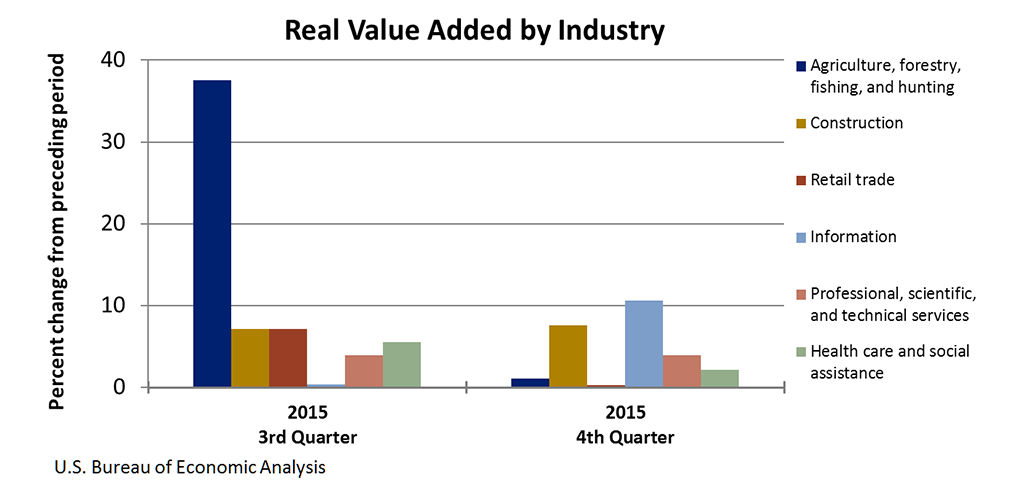
- For the information industry group, real value added—a measure of an industry's contribution to GDP—increased 10.6 percent in the fourth quarter, after increasing 0.4 percent in the third quarter. The fourth quarter growth primarily reflected an increase in broadcasting and telecommunications.
- Construction, which includes both residential and nonresidential structures, increased 7.6 percent, after increasing 7.1 percent.
- Professional, scientific, and technical services increased 3.9 percent, the same percent increase as the third quarter. This was the 11th consecutive quarter of growth for the industry, which includes services such as legal services; architectural and engineering services; and scientific research and development services.
Other highlights
- Real GDP growth slowed to 1.4 percent in the fourth quarter, from 2.0 percent in the third quarter. Retail trade was the leading contributor to the deceleration in real GDP in the fourth quarter. Real value added for the industry group increased 0.3 percent, after increasing 7.1 percent in the third quarter.
- Agriculture, forestry, fishing, and hunting increased 1.1 percent, after increasing 37.5 percent and was the second leading contributor to the slowdown. The deceleration was primarily attributed to a notable slowdown in real gross output for the farm industry.
- Health care and social assistance increased 2.1 percent, after increasing 5.5 percent, primarily reflecting a deceleration in ambulatory health care services.
Gross output by industry
Real gross output—principally a measure of an industry's sales or receipts, which includes sales to final users in the economy (GDP) and sales to other industries (intermediate inputs)—increased in the fourth quarter. This reflected increases in real gross output for both the private services-producing sector and the government sector. The private goods-producing sector decreased.
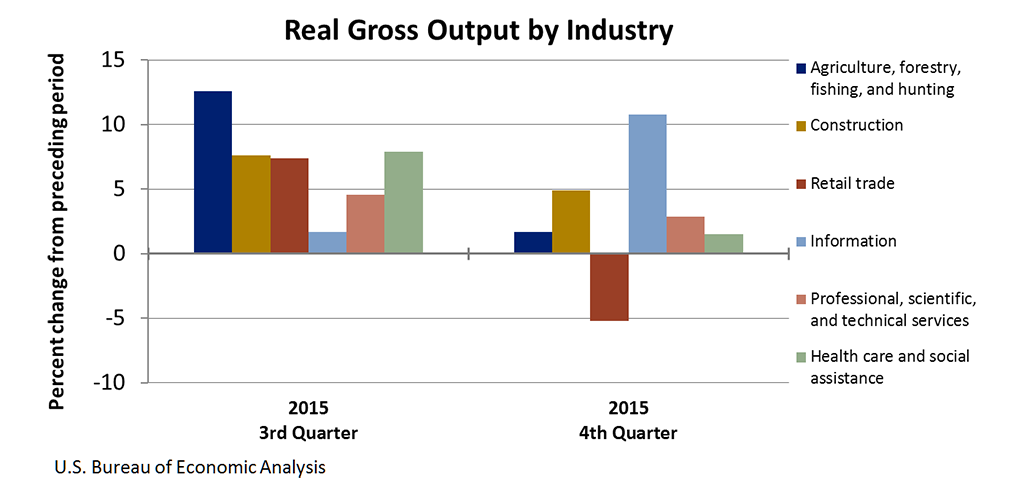
- Real gross output for information services increased 10.8 percent, after increasing 1.7 percent in the third quarter.
- Retail trade decreased 5.2 percent, after increasing 7.4 percent. The decrease primarily reflected a decline in motor vehicle and parts dealers, which was the largest decrease since the second quarter of 2012.
- Health care and social assistance increased 1.5 percent, after increasing 7.9 percent.
2015 GDP by industry
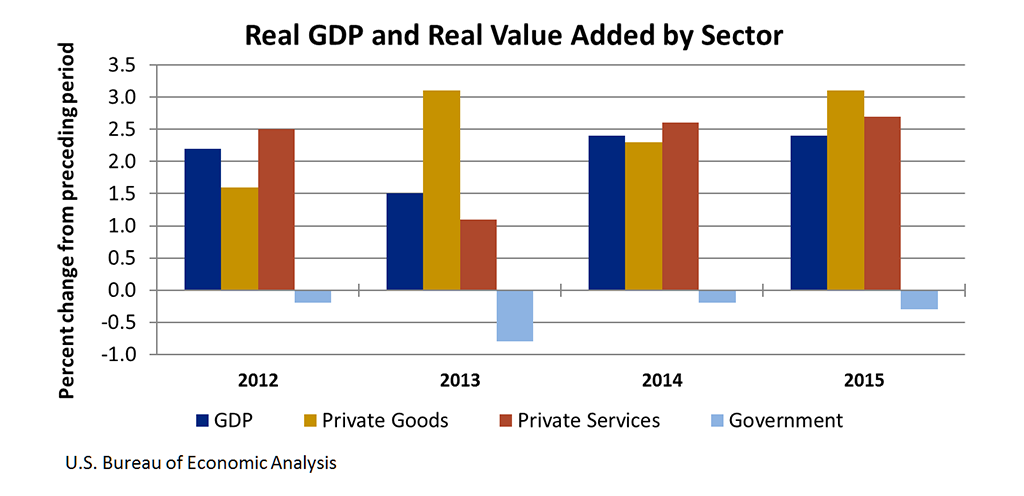
Real GDP increased 2.4 percent in 2015 (that is, from the 2014 annual level to the 2015 annual level), the same rate of increase in 2014. Both the private goods- and services-producing sectors contributed to the increase, while the government sector decreased. Growth was widespread, with 17 of 22 industry groups contributing to the increase. Professional, scientific, and technical services; information; and real estate and rental and leasing were the leading contributors to the increase in real GDP.
- Professional, scientific, and technical services real value added increased 5.0 percent in 2015, after increasing 3.3 percent in 2014. This was the largest increase since 2008.
- Information services increased 6.3 percent, after increasing 3.9 percent.
- Transportation and warehousing services decreased 2.1 percent in 2015, after increasing 0.8 percent.
****
BEA's national, international, regional, and industry estimates; BEA news releases; and related articles in the Survey of Current Business are available for free on BEA's Web site at www.bea.gov. The entire historical time series for these estimates, including 71 industry underlying detail, can be accessed in BEA's Interactive Data Application at www.bea.gov/iTable/index_industry_gdpIndy.cfm. Stay informed about BEA developments by signing up for our email subscription service or following us on Twitter @BEA_News. You also can access BEA data by registering for our Data Application Programming Interface, or API. (www.bea.gov/API/signup/index.cfm).
****
BEA's news release schedule is available at www.bea.gov/newsreleases/2016rd.htm.
Next release -- July 21, 2016 at 8:30 A.M. EDT for:
Gross Domestic Product by Industry: First Quarter 2016