
News Release
Gross Domestic Product by State, 4th quarter and Annual 2015
Information Industry Group Led Growth Across States in the Fourth Quarter
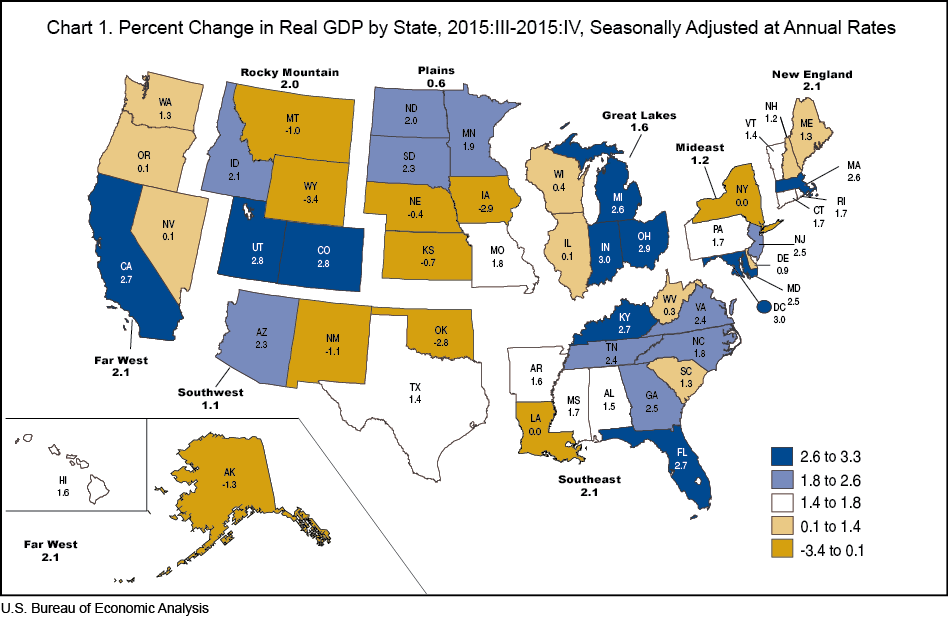
Real gross domestic product (GDP) increased in 41 states and the District of Columbia in the fourth quarter of 2015, according to statistics on the geographic breakout of GDP released today by the Bureau of Economic Analysis. Real GDP by state growth, at an annual rate, ranged from 3.0 percent in Indiana to –3.4 percent in Wyoming. Information; construction; and professional, scientific, and technical services were the leading contributors to real U.S. economic growth in the fourth quarter.
- The information industry group grew 10.6 percent in the fourth quarter of 2015. This industry contributed 0.50 percentage point to U.S. real GDP growth and contributed to growth in 49 states and the District of Columbia. This industry was the leading contributor to growth in 16 states and contributed 0.90 percentage point to real GDP growth in California.
- Construction grew 7.6 percent in the fourth quarter. This industry contributed 0.30 percentage point to U.S. real GDP growth and contributed to growth in 46 states and the District of Columbia. Alaska, New Mexico, North Dakota, and West Virginia were the exceptions. This industry contributed 1.02 percentage point to real GDP growth in Hawaii.
- Professional, scientific, and technical services grew 3.9 percent in the fourth quarter—the 11th consecutive quarter of growth for this industry. This industry contributed 0.28 percentage point to real GDP growth for the nation and contributed to growth in 48 states and the District of Columbia. This industry contributed 0.92 percentage point to real GDP growth in the District of Columbia.
Other highlights
- Nondurable goods manufacturing also made a significant contribution to real GDP growth in the fourth quarter. This industry grew 4.5 percent for the nation, contributed 0.24 percentage point to U.S. real GDP growth and contributed to growth in 45 states and the District of Columbia. This industry was the leading contributor to growth in Indiana, the fastest growing state in the fourth quarter.
- Mining declined 10.7 percent for the nation in the fourth quarter. This industry subtracted more than 2.2 percentage points from real GDP growth in Alaska, North Dakota, Oklahoma, and Wyoming.
- Finance and insurance declined 3.1 percent in the fourth quarter. This industry subtracted 0.22 percentage point from U.S. real GDP growth and subtracted 0.75 percentage point or more from real GDP growth in South Dakota, Delaware, and New York.
Tables 1–3 (Excel) show these results in more detail; complete detail is available on BEA's Web site at www.bea.gov.
The next quarterly GDP by state release is scheduled for July 27, 2016 and will cover the first quarter of 2016.
Annual Revision of Gross Domestic Product by State
In conjunction with today's release of fourth quarter 2015 gross domestic product (GDP) by state statistics, BEA is making available on its Web site revised statistics for 2008–2014 and annual statistics for 2015. The annual revision of GDP by state incorporates newly available and revised state source data, most notably the 2012 Economic Census for industries (except for manufacturing, which was previously incorporated).
Additional information on this revision will be available in an article in the July 2016 issue of the Survey of Current Business.
Explanatory Notes
Definitions. GDP by state is the state counterpart of the Nation's gross domestic product (GDP), the Bureau's featured and most comprehensive measure of U.S. economic activity. GDP by state is derived as the sum of the GDP originating in all the industries in a state.
The statistics of real GDP by state are prepared in chained (2009) dollars. Real GDP by state is an inflation-adjusted measure of each state's gross product that is based on national prices for the goods and services produced within that state. The statistics of real GDP by state and quantity indexes with a reference year of 2009 were derived by applying national chain-type price indexes to the current-dollar values of GDP by state for the 21 NAICS-based industry sectors.
The chain-type index formula that is used in the national accounts is then used to calculate the values of total real GDP by state and real GDP by state at more aggregated industry levels. Real GDP by state may reflect a substantial volume of output that is sold to other states and countries. To the extent that a state's output is produced and sold in national markets at relatively uniform prices (or sold locally at national prices), real GDP by state captures the differences across states that reflect the relative differences in the mix of goods and services that the states produce. However, real GDP by state does not capture geographic differences in the prices of goods and services that are produced and sold locally.
Relation of Gross Domestic Product (GDP) by State for the U.S. to GDP in the National Accounts. An industry's GDP by state, or its value added, in practice, is calculated as the sum of incomes earned by labor and capital and the costs incurred in the production of goods and services. That is, it includes the wages and salaries that workers earn, the income earned by individual or joint entrepreneurs as well as by corporations, and business taxes such as sales, property, and Federal excise taxes—that count as a business expense.
GDP is calculated as the sum of what consumers, businesses, and government spend on final goods and services, plus investment and net foreign trade. In theory, incomes earned should equal what is spent, but due to different data sources, the measurement of income earned, usually referred to as gross domestic income (GDI), does not always equal the measurement of what is spent (GDP). The difference is referred to as the "statistical discrepancy."
GDP by state for the U.S. differs from the GDP in the national income and product accounts (NIPAs) and thus from the Industry Economic Accounts' GDP by industry, because GDP by state for the U.S. excludes federal military and civilian activity located overseas, which cannot be attributed to a particular state.
BEA's national, international, regional, and industry estimates; the Survey of Current Business; and BEA news releases are available without charge on BEA's Web site at www.bea.gov. By visiting the site, you can also subscribe to receive free e-mail summaries of BEA releases and announcements.