
News Release
New Foreign Direct Investment in the United States, 2014 and 2015
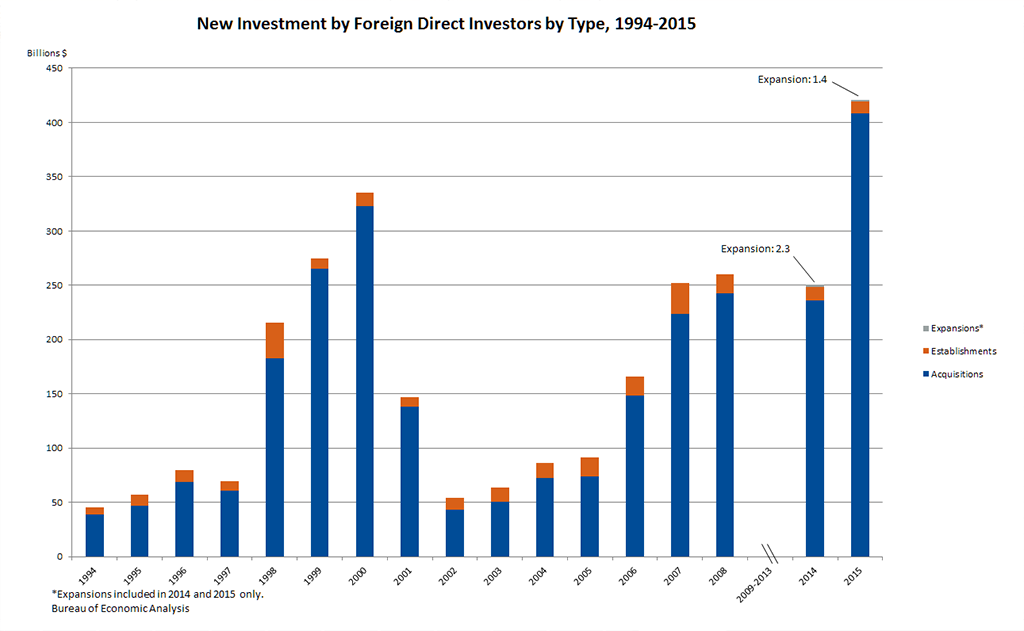
Expenditures by foreign direct investors to acquire, establish, or expand U.S. businesses totaled $420.7 billion in 2015, an increase of 68 percent from 2014, when expenditures were $250.6 billion. In 2015, as in 2014, the majority of the expenditures were to acquire existing businesses. In 2015, expenditures for acquisitions were $408.1 billion. Expenditures to establish new U.S. businesses were $11.2 billion, and expenditures to expand existing foreign-owned businesses were $1.4 billion. Planned total expenditures, which include both actual and planned future expenditures, totaled $439.2 billion.
Newly Available Statistics
In conjunction with today’s release, BEA is introducing new statistics for 2014 and 2015 on the activities of newly acquired, established, or expanded U.S. affiliates by state, country, and industry. These new statistics supplement the statistics on expenditures for new investment and include current and planned employment and balance sheet and income statement items, specifically sales, net income, assets, liabilities, and total owner’s equity, for the affiliates. The statistics offer more detail, including state-level detail, than similar statistics BEA produced until 2008. The new statistics are available with the statistics on expenditures for new investment on BEA’s web site in the interactive tables.
New investment expenditures include expenditures incurred by foreign direct investors and by existing U.S. affiliates of foreign direct investors. The portion of new investment expenditures provided by foreign direct investors is included in BEA’s statistics on foreign direct investment transactions. These expenditures contribute to the foreign direct investment position in the United States, which represents the accumulated total value of foreign direct investment, totaling $3.1 trillion (on a historical-cost basis) at yearend 2015. However, not all of the transactions that contribute to the foreign direct investment position are included in the statistics on new investment expenditures. The new investment data exclude disinvestment flows and other transactions between foreign direct investors and their U.S. affiliates that do not contribute to the acquisition, establishment, or expansion of a U.S. business.
Expenditures by industry, country, and state
Expenditures for new investment in manufacturing were $281.4 billion in 2015. As in 2014, manufacturing accounted for more than half of total new investment expenditures. Within manufacturing, expenditures were largest in chemicals, mostly in pharmaceuticals and medicines. There were also large expenditures in finance and insurance, in real estate and rental and leasing, and in professional, scientific, and technical services.
By country of ultimate beneficial owner (UBO), the largest source country was Ireland, at $176.5 billion. There were also substantial expenditures from Canada and Germany. Of the eight largest countries in terms of foreign direct investment position in the United States—United Kingdom, Japan, Luxembourg, Netherlands, Canada, Switzerland, Germany, and France—six are also among the top eight countries for new foreign direct investment.
By U.S. state, the largest expenditures, $119.0 billion, or 28 percent of the total, were for investments in California.
Greenfield expenditures
Greenfield investment expenditures—expenditures to either establish a new U.S. business or to expand an existing foreign-owned U.S. business—totaled $12.6 billion in 2015. In 2014, greenfield expenditures were $14.8 billion. Total planned greenfield expenditures for investment initiated in 2015, which include both first-year expenditures and planned spending in other years, totaled $31.2 billion.
By industry, 2015 greenfield expenditures were largest in real estate and rental and leasing, at $6.2 billion, accounting for about half of total first-year greenfield expenditures. By U.S. state, New York attracted the most expenditures for greenfield investment, $4.0 billion. There were also large greenfield investments in Pennsylvania and California.
Employment by newly acquired, established, or expanded foreign-owned businesses
In 2015, employment at newly acquired, established, or expanded foreign-owned businesses in the United States was 422,200. (Statistics on employment at expanded business only include employment at the expanded portion of the business.) Total planned employment, which includes current employment of acquired enterprises, the planned employment of newly established business enterprises once they are fully operating, and the planned employment associated with new facilities, was 461,600. Of these totals, the current employment of acquired enterprises was 418,000.
By industry, manufacturing accounted for the largest number of 2015 employees, at 139,500. Employment was also substantial in administration, support, and waste management, and in retail trade. By country of UBO, the largest number of employees was accounted for by Canada and France. By U.S. state, the largest numbers of employees were in California and Arizona.
Revisions
This release updates preliminary data on expenditures for new foreign direct investment in the United States for 2014 that were released in November 2015.
Revisions to 2014 Expenditures for New Foreign Direct Investment in the United States
|
[Millions of dollars] |
||
|
Preliminary |
Revised |
|
|
First-year expenditures |
||
|
Total |
241,261 |
250,581 |
|
U.S. businesses acquired |
224,688 |
235,799 |
|
U.S. businesses established |
13,822 |
12,473 |
|
U.S. businesses expanded |
2,751 |
2,309 |
|
Planned total expenditures |
||
|
Total |
263,858 |
275,767 |
|
U.S. businesses acquired |
224,688 |
235,799 |
|
U.S. businesses established |
31,345 |
33,516 |
|
U.S. businesses expanded |
7,825 |
6,453 |