
News Release
U.S. International Investment Position, 2nd quarter 2016
The U.S. net international investment position at the end of the second quarter of 2016 was -$8,042.8 billion (preliminary), according to statistics released today by the Bureau of Economic Analysis (BEA). The net investment position at the end of the first quarter was -$7,582.0 billion (revised).
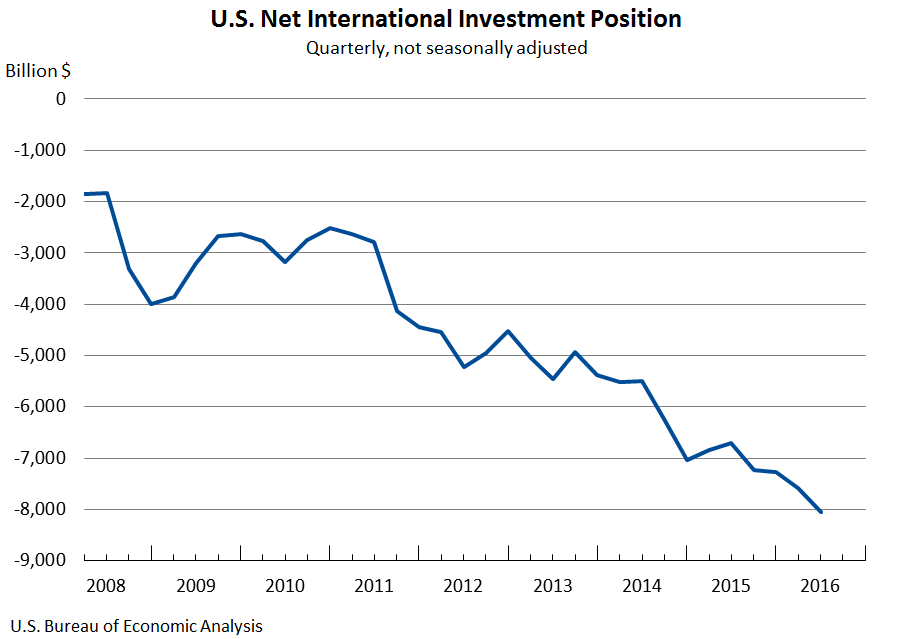
- The net investment position decreased $460.8 billion or 6.1 percent in the second quarter, compared with a decrease of 4.1 percent in the first quarter, and an average quarterly decrease of 6.1 percent from the first quarter of 2011 through the fourth quarter of 2015.
- The $460.8 billion decrease in the net position reflected a $479.9 billion decrease in the net position excluding financial derivatives that was partly offset by a $19.1 billion increase in the net position in financial derivatives.
U.S. assets increased $404.1 billion to $24,465.9 billion at the end of the second quarter, reflecting increases in both financial derivatives and assets excluding financial derivatives.
- Financial derivatives with a positive fair value increased $241.4 billion to $3,223.7 billion, mostly in single-currency interest rate contracts.
- Assets excluding financial derivatives increased $162.7 billion to $21,242.1 billion, reflecting increases in other investment, portfolio investment, and reserve assets that were partly offset by a decrease in direct investment. Increases resulting from financial transactions were partly offset by depreciation of major foreign currencies against the U.S. dollar that lowered the value of U.S. assets in dollar terms.
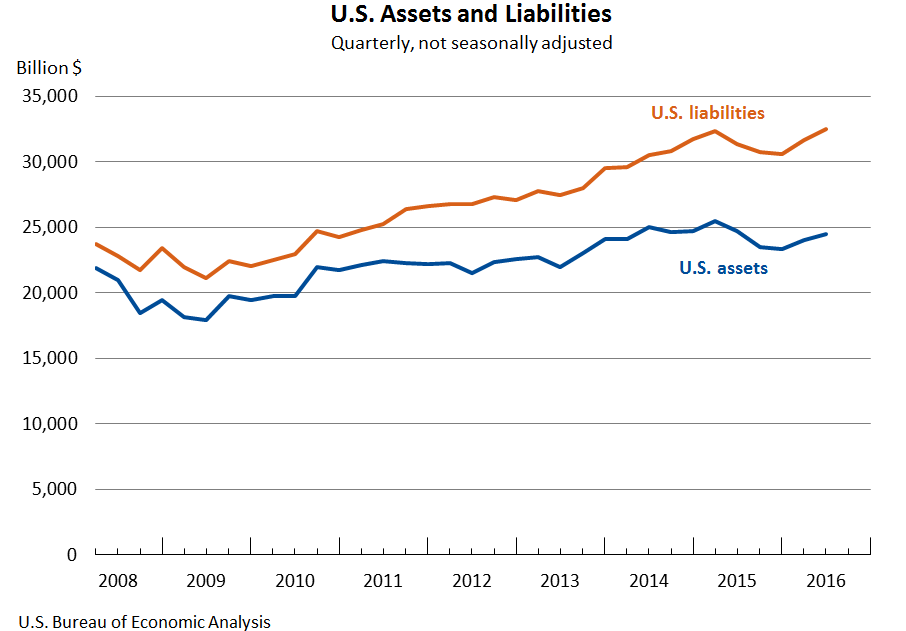
U.S. liabilities increased $864.9 billion to $32,508.7 billion at the end of the second quarter, reflecting increases in both financial derivatives and liabilities excluding financial derivatives.
- Liabilities excluding financial derivatives increased $642.6 billion to $29,343.0 billion, reflecting increases in all major categories of liabilities. Increases resulting from financial transactions and increases in U.S. bond and equity prices contributed to the increase in liabilities.
- Financial derivatives with a negative fair value increased $222.3 billion to $3,165.7 billion, mostly in single-currency interest rate contracts.
Updates to International Investment Position Statistics
| Preliminary estimate | Revised estimate | |
|---|---|---|
| U.S. net international investment position | -7,525.6 | -7,582.0 |
| U.S. assets | 24,082.9 | 24,061.8 |
| Direct investment at market value | 7,012.4 | 6,993.1 |
| Portfolio investment | 9,622.7 | 9,607.1 |
| Financial derivatives | 2,981.8 | 2,982.3 |
| Other investment | 4,034.1 | 4,047.3 |
| Reserve assets | 432.0 | 432.0 |
| U.S. liabilities | 31,608.5 | 31,643.8 |
| Direct investment at market value | 6,637.6 | 6,664.8 |
| Portfolio investment | 16,907.3 | 16,916.9 |
| Financial derivatives | 2,942.6 | 2,943.3 |
| Other investment | 5,121.0 | 5,118.8 |
Next release: December 29, 2016, at 8:30 A.M. EST
U.S. Net International Investment Position, Third Quarter 2016