
News Release
U.S. International Investment Position, 4th quarter 2015
Notice About the 2016 Annual Revision of the U.S. Net International Investment Position
The annual revision of the U.S. net international investment position will be released along with preliminary estimates for the first quarter of 2016 on June 30, 2016. An article previewing the annual revisions will appear in the April 2016 issue of the Survey of Current Business.
Fourth Quarter
The U.S. net international investment position at the end of the fourth quarter of 2015 was -$7,356.8 billion (preliminary) as the value of U.S. liabilities exceeded the value of U.S. assets (chart 1, table 1). At the end of the third quarter, the net investment position was -$7,311.6 billion (revised).
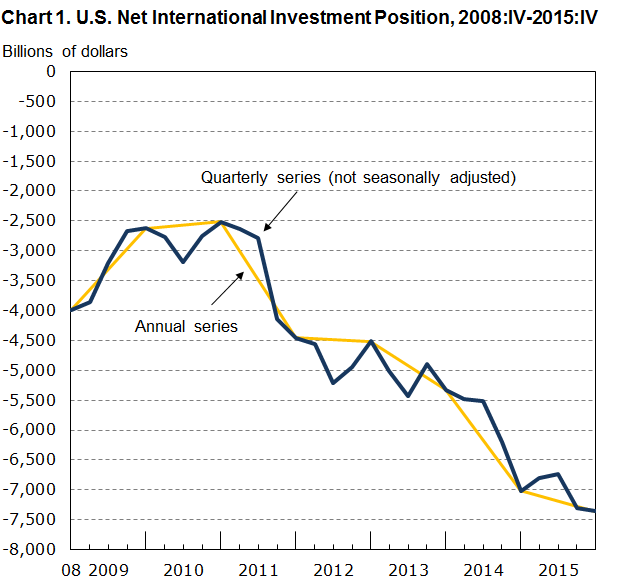
The net investment position decreased 0.6 percent in the fourth quarter, compared with a decrease of 8.4 percent in the third quarter and an average quarterly decrease of 6.3 percent from the first quarter of 2011 through the second quarter of 2015. The net investment position was equal to 3.5 percent of the value of all U.S. financial assets at the end of the fourth quarter, down from 3.6 percent at the end of the third quarter.1
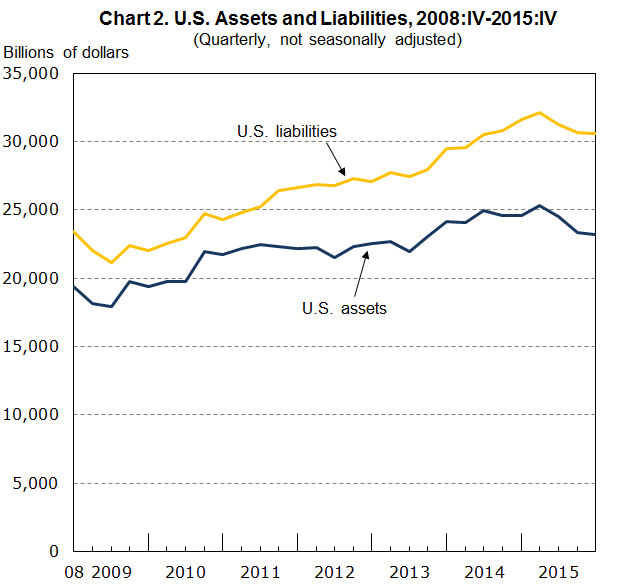
U.S. assets were $23,208.3 billion at the end of the fourth quarter compared with $23,326.7 billion at the end of the third quarter (chart 2). The $118.5 billion decrease reflected a $323.6 billion decrease in the value of financial derivatives, mostly in single-currency interest rate contracts, that was partly offset by a $205.1 billion increase in the value of assets excluding financial derivatives.
U.S. assets excluding financial derivatives were $20,810.6 billion at the end of the fourth quarter compared with $20,605.5 billion at the end of the third quarter. The $205.1 billion increase mostly reflected increases in foreign equity prices that increased the value of U.S. direct investment and portfolio investment assets, which was partly offset by the depreciation of major foreign currencies against the U.S. dollar that lowered the value of U.S. assets in dollar terms.2
U.S. liabilities were $30,565.1 billion at the end of the fourth quarter compared with $30,638.4 billion at the end of the third quarter (chart 2). The $73.3 billion decrease reflected a $324.1 billion decrease in the value of financial derivatives, mostly in single-currency interest rate contracts, that was partly offset by a $250.7 billion increase in the value of liabilities excluding financial derivatives.
U.S. liabilities excluding financial derivatives were $28,224.5 billion at the end of the fourth quarter compared with $27,973.8 billion at the end of the third quarter. The $250.7 billion increase mostly reflected increases in U.S. equity prices that increased the value of U.S. direct investment and portfolio investment liabilities, which was partly offset by decreases in prices on long-term debt securities.
Revisions
The U.S. net international investment position at the end of the third quarter of 2015 was revised to -$7,311.6 billion from the previously-published value of -$7,269.8 billion. The $41.8 billion downward revision to the net position reflected a $14.8 billion upward revision to U.S. assets and a $56.6 billion upward revision to U.S. liabilities.
U.S. assets at the end of the third quarter were revised to $23,326.7 billion from $23,311.9 billion; U.S. liabilities were revised to $30,638.4 billion from $30,581.8 billion. These revisions reflect revised source data from the Treasury International Capital (TIC) reporting system and from BEA's quarterly surveys of direct investment.
Year 2015
The U.S. net international investment position was -$7,356.8 billion (preliminary) at the end of 2015 compared with -$7,019.7 billion at the end of 2014. The $337.1 billion decrease in the net position reflected a $1,387.3 billion decrease in the value of U.S. assets that exceeded a $1,050.2 billion decrease in the value of U.S. liabilities. The U.S. net international investment position decreased 4.8 percent from the end of 2014 to the end of 2015, compared with a 31.8 percent decrease from the end of 2013 to the end of 2014.
U.S. assets were $23,208.3 billion at the end of 2015 compared with $24,595.5 billion at the end of 2014. The $1,387.3 billion decrease reflected an $826.9 billion decrease in the value of financial derivatives, mostly in single-currency interest rate contracts, and a $560.4 billion decrease in the value of assets excluding financial derivatives.
U.S. assets excluding financial derivatives were $20,810.6 billion at the end of 2015 compared with $21,371.0 billion at the end of 2014. The $560.4 billion decrease was mostly attributable to the depreciation of major foreign currencies against the U.S. dollar that lowered the value of U.S. assets in dollar terms.
U.S. liabilities were $30,565.1 billion at the end of 2015 compared with $31,615.2 billion at the end of 2014. The $1,050.2 billion decrease reflected an $810.1 billion decrease in the value of financial derivatives, mostly in single-currency interest rate contracts, and a $240.0 billion decrease in the value of liabilities excluding financial derivatives.
U.S. liabilities excluding financial derivatives were $28,224.5 billion at the end of 2015 compared with $28,464.6 billion at the end of 2014. The $240.0 billion decrease was mostly attributable to decreases in U.S. equity and bond prices that lowered the value of portfolio investment liabilities.
****
NOTE: This news release is available on BEA's Web site (www.bea.gov) along with quarterly highlights and annual highlights related to this release, the latest detailed statistics for the U.S. international investment position, and a description of the estimation methods used to compile them. The fourth-quarter and year 2015 statistics in this release are preliminary and will be revised on June 30, 2016.
1 Board of Governors of the Federal Reserve System (FRS), Financial Accounts of the United States, Fourth Quarter 2015, Z.1. Statistical Release (Washington, DC: FRS, March 10, 2016). According to the March release, the value of all U.S. financial assets was $207,686.9 billion at the end of the fourth quarter. The value of U.S. assets abroad was $23,208.3 billion, or 11.2 percent of all U.S. financial assets, down from 11.4 percent at the end of the third quarter.
2 According to the Federal Reserve Board's major currencies index, foreign currencies depreciated 2.3 percent against the U.S. dollar from the end of the third quarter to the end of the fourth quarter. The major currencies index is a weighted average of the foreign exchange values of the U.S. dollar against a subset of the broad index currencies that circulate widely outside the country of issue. See Foreign Exchange Rates—H10 (weekly release of daily data), Nominal Major Currencies Index at www.federalreserve.gov.
Release dates in 2016
| End of the Fourth Quarter and Year 2015 | March 31, 2016 (Thursday) |
| End of the First Quarter of 2016, Year 2015, and Annual Revisions | June 30, 2016 (Thursday) |
| End of the Second Quarter of 2016 | September 27, 2016 (Tuesday) |
| End of the Third Quarter of 2016 | December 29, 2016 (Thursday) |
BEA statistics—including GDP, personal income, the balance of payments, foreign direct investment, the input-output accounts, and economic statistics for states, local areas, and industries—are available on the BEA Web site: www.bea.gov. E-mail alerts are also available.