
News Release
Gross Domestic Product by State, 4th quarter 2016 and annual 2016
Finance and Insurance Led Growth Across States in the Fourth Quarter
Real gross domestic product (GDP) increased in every state and the District of Columbia in the fourth quarter of 2016, according to statistics on the geographic breakout of GDP released today by the U.S. Bureau of Economic Analysis. Real GDP by state growth ranged from 3.4 percent in Texas to 0.1 percent in Kansas and Mississippi (table 1 and chart 1). Finance and insurance; retail trade; and professional, scientific, and technical services were the leading contributors to U.S. economic growth in the fourth quarter.
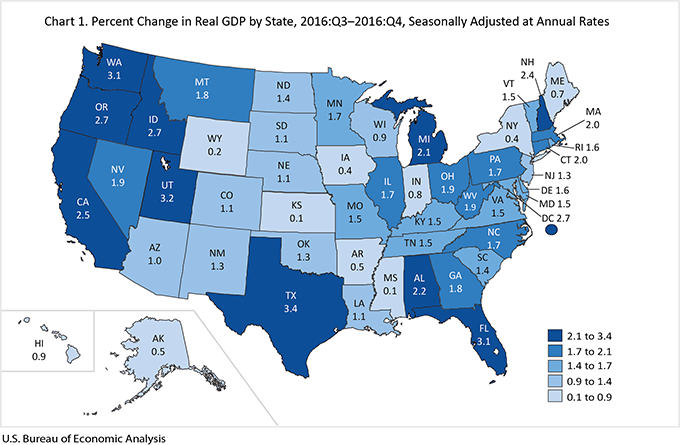
- Finance and insurance grew 6.3 percent in the fourth quarter of 2016. This industry contributed to growth in 49 states and the District of Columbia (table 2). The largest contributions to growth occurred in Delaware and South Dakota; these states grew 1.6 percent and 1.1 percent, respectively.
- Retail trade grew 5.7 percent. This industry contributed to growth in every state. The largest contributions to growth occurred in Washington and Texas; these states grew 3.1 percent and 3.4 percent, respectively.
- Professional, scientific, and technical services grew 3.6 percent. This industry contributed to growth in 47 states and the District of Columbia. The largest contributions to growth occurred in the District of Columbia and Utah. The District of Columbia grew 2.7 percent while Utah grew 3.2 percent.
Other fourth quarter highlights
- Mining grew 5.2 percent after six straight quarters of decline. It was the largest contributor to growth in West Virginia, North Dakota, and Oklahoma; these states grew 1.9 percent, 1.4 percent and 1.3 percent, respectively.
- The fastest growing states were Texas, Utah, and Washington which grew 3.4 percent, 3.2 percent, and 3.1 percent, respectively. The largest contributor to growth in Texas was real estate and rental and leasing while the largest contributors to growth in Utah and Washington were finance and insurance and information services, respectively.
- The slowest growing states were Mississippi, Kansas, and Wyoming which grew 0.1 percent, 0.1 percent, and 0.2 percent, respectively. Nondurable-goods manufacturing subtracted the most from growth in Mississippi and Kansas while agriculture, forestry, fishing, and hunting subtracted the most from growth in Wyoming.
Annual GDP by State in 2016
Real GDP growth slowed to 1.5 percent in 2016 after increasing 2.6 percent in 2015. Real GDP grew in 43 states and the District of Columbia. Real GDP by state growth ranged from 3.7 percent in Washington to -6.5 percent in North Dakota (table 4 and chart 2). Information services; professional, scientific, and technical services; and health care and social assistance were the leading contributors to growth in 2016. In contrast, a decline in mining subtracted from growth nationally.
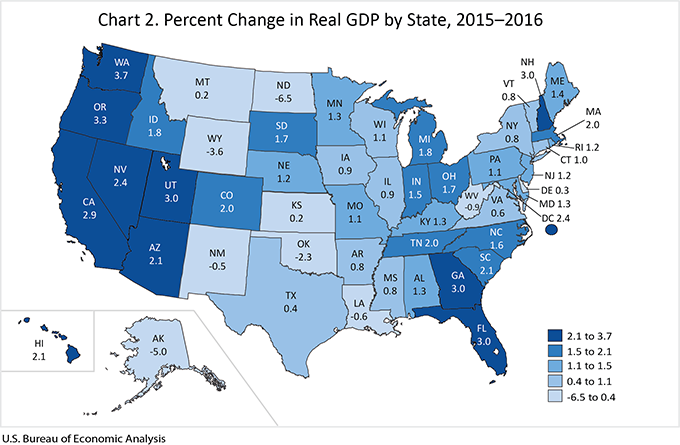
- Information services grew 6.4 percent in 2016. This industry contributed to growth in 46 states and the District of Columbia. The largest contributions to growth occurred in Washington and California; these states grew 3.7 percent and 2.9 percent, respectively.
- Professional, scientific, and technical services grew 3.3 percent. This industry contributed to growth in 44 states and the District of Columbia. The largest contributions to growth occurred in the District of Columbia and Minnesota. The District of Columbia grew 2.4 percent while Minnesota grew 1.3 percent.
- Health care and social assistance grew 3.0 percent. This industry contributed to growth in 48 states and the District of Columbia. The largest contributions to growth occurred in Arizona and Montana; these states grew 2.1 percent and 0.2 percent, respectively.
Other annual highlights
- The fastest growing states were Washington, Oregon, and Utah which grew 3.7 percent, 3.3 percent, and 3.0 percent, respectively. The largest contributor to growth in Washington and Utah was information services while the largest contributor to growth in Oregon was durable-goods manufacturing.
- The states with the largest declines were North Dakota, Alaska, and Wyoming which declined 6.5 percent, 5.0 percent, and 3.6 percent, respectively. Mining was the largest contributor to the decline in each of these states.
Updates to Gross Domestic Product by State
In addition to the statistics presented in this news release, BEA also revised quarterly GDP by state statistics for 2013:Q1 to 2016:Q3 and annual statistics for 2013–2015. Updates are made each year about this time to incorporate new and revised state source data.
An article in the June 2017 issue of the Survey of Current Business will provide additional information about the update to GDP by state.