
News Release
U.S. International Investment Position, 1st quarter 2017, Year 2016, and annual update
ERRATA Table 1 and relevant text in the "U.S. Net International Investment Position: First Quarter 2017, Year 2016, and Annual Update" news release and corresponding statistics in the Interactive Tables were corrected on July 5, 2017. The corrections affect statistics for portfolio investment long-term debt liabilities and related aggregate statistics for the first quarter of 2017. Related financial transactions statistics were also corrected.
First Quarter 2017
The U.S. net international investment position increased to -$8,141.2 billion (preliminary) at the end of the first quarter of 2017 from -$8,318.4 billion (revised) at the end of the fourth quarter of 2016, according to statistics released today by the Bureau of Economic Analysis (BEA). The $177.2 billion increase reflected a $983.8 billion increase in U.S. assets and an $806.6 billion increase in U.S. liabilities (table 1).
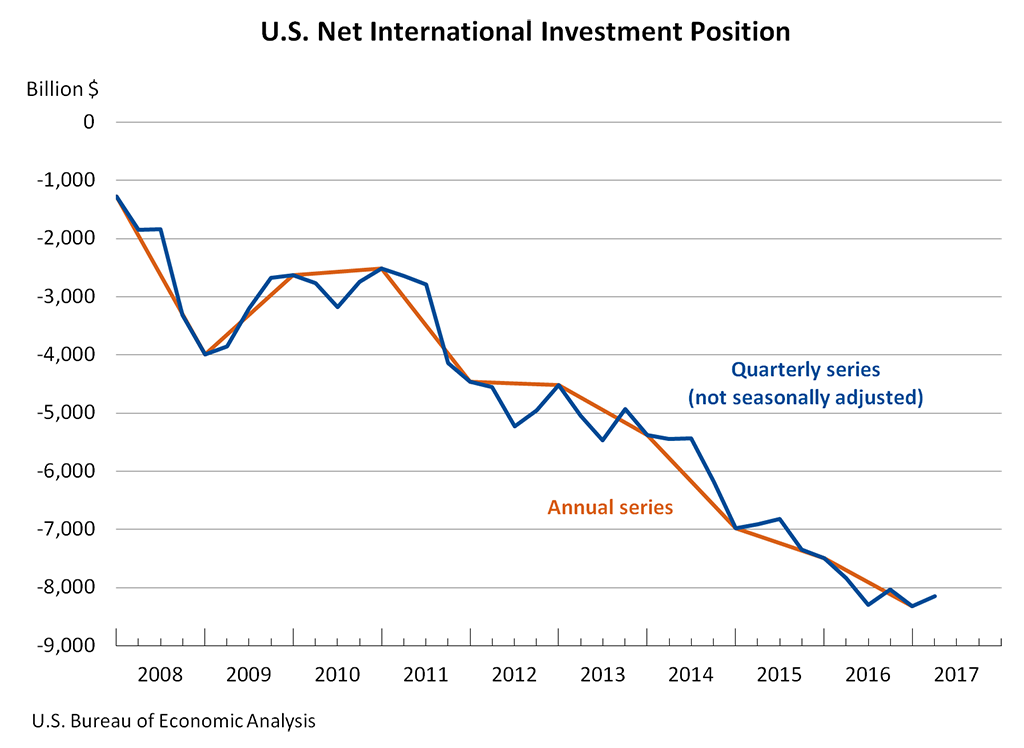
The net investment position increased 2.1 percent in the first quarter, compared with a decrease of 3.5 percent in the fourth quarter and an average quarterly decrease of 5.7 percent from the first quarter of 2011 through the third quarter of 2016.
U.S. assets increased $983.8 billion to $24,833.2 billion at the end of the first quarter.
- Assets excluding financial derivatives increased $1,246.1 billion to $22,886.5 billion, mostly reflecting increases in portfolio investment and direct investment assets. The $1,246.1 billion increase resulted from other changes in position of $951.9 billion and financial transactions of $294.1 billion (table A). Other changes in position mostly reflected price increases on portfolio investment and direct investment equity assets and the appreciation of major foreign currencies against the U.S. dollar that raised the value of assets in dollar terms.
- Financial derivatives decreased $262.3 billion to $1,946.7 billion, reflecting decreases in single-currency interest rate contracts and foreign exchange contracts.
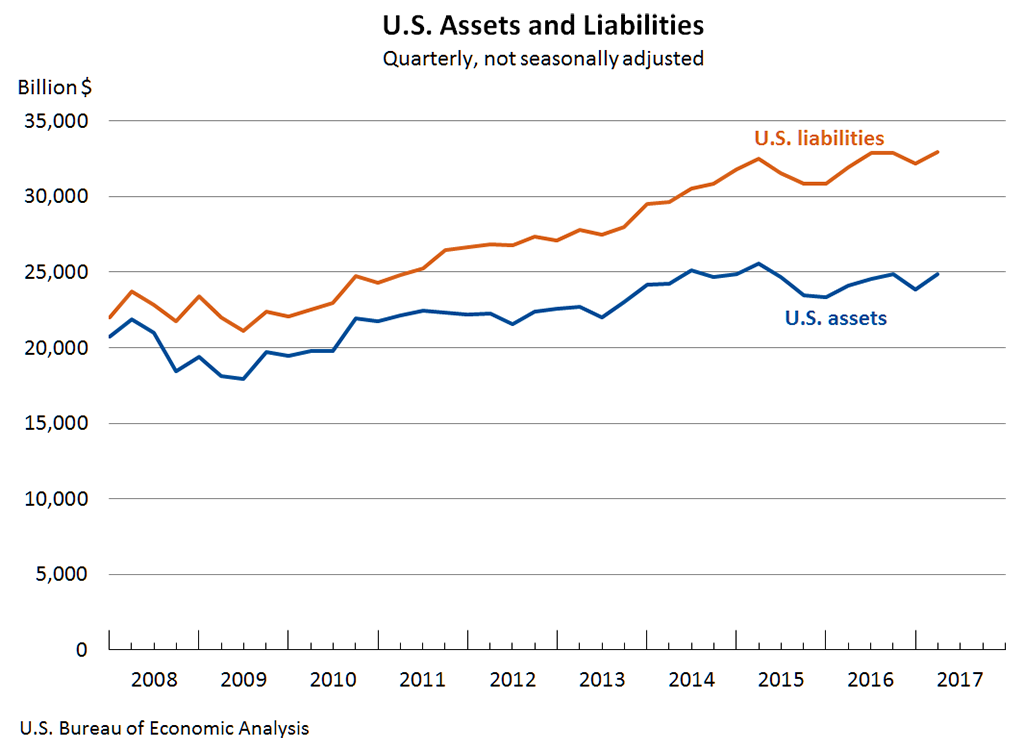
U.S. liabilities increased $806.6 billion to $32,974.5 billion at the end of the first quarter.
- Liabilities excluding financial derivatives increased $1,049.2 billion to $31,069.4 billion, mostly reflecting increases in portfolio investment and direct investment liabilities. The $1,049.2 billion increase resulted from other changes in position of $656.1 billion and financial transactions of $393.2 billion (table A). Other changes in position were driven by price increases on portfolio investment and direct investment equity liabilities.
- Financial derivatives decreased $242.6 billion to $1,905.1 billion, reflecting decreases in single-currency interest rate contracts and foreign exchange contracts.
| Position, 2016:IV | Change in position in 2017:I | Position, 2017:I | |||
|---|---|---|---|---|---|
| Total | Attributable to: | ||||
| Financial transactions | Other changes in position 1 | ||||
| U.S. net international investment position | -8,318.4 | 177.2 | -102.0 | 279.2 | -8,141.2 |
| Net position excluding financial derivatives | -8,379.7 | 196.8 | -99.0 | 295.9 | -8,182.9 |
| Financial derivatives other than reserves, net | 61.3 | -19.7 | -3.0 | -16.7 | 41.6 |
| U.S. assets | 23,849.4 | 983.8 | (2) | (2) | 24,833.2 |
| Assets excluding financial derivatives | 21,640.5 | 1,246.1 | 294.1 | 951.9 | 22,886.5 |
| Financial derivatives other than reserves | 2,209.0 | -262.3 | (2) | (2) | 1,946.7 |
| U.S. liabilities | 32,167.8 | 806.6 | (2) | (2) | 32,974.5 |
| Liabilities excluding financial derivatives | 30,020.1 | 1,049.2 | 393.2 | 656.1 | 31,069.4 |
| Financial derivatives other than reserves | 2,147.7 | -242.6 | (2) | (2) | 1,905.1 |
| 1 Disaggregation of other changes in position into price changes, exchange-rate changes, and other changes in volume and valuation is only presented for annual statistics (see table B and table 2 in this release). | |||||
| 2 Financial transactions and other changes in financial derivatives positions are available only on a net basis; they are not separately available for U.S. assets and U.S. liabilities. | |||||
Year 2016
The U.S. net international investment position decreased to -$8,318.4 billion (revised) at the end of 2016 from -$7,493.5 billion (revised) at the end of 2015. The $824.9 billion decrease was driven by net exchange-rate changes of -$473.0 billion and net financial transactions of -$377.7 billion (table B).
| Position, 2015 | Change in position in 2016 | Position, 2016 | ||||||
|---|---|---|---|---|---|---|---|---|
| Total | Attributable to: | |||||||
| Financial transactions | Other changes in position | |||||||
| Total | Price changes | Exchange-rate changes | Changes in volume and valuation n.i.e. | |||||
| U.S. net investment position | -7,493.5 | -824.9 | -377.7 | -447.2 | (1) | (1) | (1) | -8,318.4 |
| Net position excl. derivatives | -7,549.8 | -829.9 | -393.5 | -436.4 | 37.3 | -473.0 | -0.7 | -8,379.7 |
| Financial derivatives, net | 56.3 | 5.0 | 15.8 | -10.8 | (1) | (1) | (1) | 61.3 |
| U.S. assets | 23,352.4 | 497.1 | (2) | (2) | (2) | (2) | (2) | 23,849.4 |
| Assets excl. derivatives | 20,924.1 | 716.3 | 347.9 | 368.4 | 833.7 | -497.9 | 32.7 | 21,640.5 |
| Financial derivatives | 2,428.2 | -219.3 | (2) | (2) | (2) | (2) | (2) | 2,209.0 |
| U.S. liabilities | 30,845.9 | 1,322.0 | (2) | (2) | (2) | (2) | (2) | 32,167.8 |
| Liabilities excl. derivatives | 28,473.9 | 1,546.2 | 741.4 | 804.8 | 796.4 | -24.9 | 33.3 | 30,020.1 |
| Financial derivatives | 2,371.9 | -224.3 | (2) | (2) | (2) | (2) | (2) | 2,147.7 |
| 1 Data are not separately available for price changes, exchange-rate changes, and changes in volume and valuation not included elsewhere. | ||||||||
| 2 Financial transactions and other changes in financial derivatives positions are available only on a net basis; they are not separately available for U.S. assets and U.S. liabilities. | ||||||||
U.S. assets increased $497.1 billion to $23,849.4 billion at the end of 2016, reflecting a $716.3 billion increase in assets excluding financial derivatives that was partly offset by a $219.3 billion decrease in financial derivatives. The increase in assets excluding financial derivatives reflected price changes of $833.7 billion, financial transactions of $347.9 billion, and changes in volume and valuation n.i.e. (not included elsewhere) of $32.7 billion that were partly offset by exchange-rate changes of -$497.9 billion (table 2).
All major asset categories increased except financial derivatives.
- Direct investment assets at market value increased $376.1 billion to $7,375.0 billion, reflecting increases from financial transactions, mostly from reinvestment of earnings in equity investment, and from equity price increases. These increases were partly offset by a decrease from exchange-rate changes.
- Portfolio investment assets increased $309.1 billion to $9,879.2 billion, mostly reflecting an increase from price changes that was partly offset by a decrease from exchange-rate changes.
- Reserve assets increased $23.6 billion to $407.2 billion, driven by price increases on monetary gold.
- Other investment assets (currency and deposits, loans, insurance technical reserves, and trade credit and advances) increased $7.6 billion to $3,978.9 billion.
- Financial derivatives decreased $219.3 billion to $2,209.0 billion, mostly reflecting a decrease in single-currency interest rate contracts.
U.S. liabilities increased $1,322.0 billion to $32,167.8 billion at the end of 2016, reflecting a $1,546.2 billion increase in liabilities excluding financial derivatives that was partly offset by a $224.3 billion decrease in financial derivatives. The increase in liabilities excluding financial derivatives reflected price changes of $796.4 billion, financial transactions of $741.4 billion, and changes in volume and valuation n.i.e. of $33.3 billion that were partly offset by exchange-rate changes of -$24.9 billion (table 2).
Increases in direct investment and portfolio investment liabilities were partly offset by decreases in financial derivatives and other investment liabilities.
- Direct investment liabilities at market value increased $868.4 billion to $7,569.3 billion, reflecting increases from financial transactions and equity price increases.
- Portfolio investment liabilities increased $706.5 billion to $17,352.3 billion, mostly due to equity price increases and net foreign purchases of U.S. debt securities.
- Financial derivatives decreased $224.3 billion to $2,147.7 billion, mostly reflecting a decrease in single-currency interest rate contracts.
- Other investment liabilities (currency and deposits, loans, insurance technical reserves, trade credit and advances, and special drawing rights allocations) decreased $28.7 billion to $5,098.6 billion.
| Preliminary estimate | Revised estimate | |
|---|---|---|
| U.S. net international investment position | -8,109.7 | -8,318.4 |
| U.S. assets | 23,916.7 | 23,849.4 |
| Direct investment at market value | 7,411.8 | 7,375.0 |
| Portfolio investment | 9,922.3 | 9,879.2 |
| Financial derivatives other than reserves | 2,209.0 | 2,209.0 |
| Other investment | 3,966.3 | 3,978.9 |
| Reserve assets | 407.2 | 407.2 |
| U.S. liabilities | 32,026.3 | 32,167.8 |
| Direct investment at market value | 7,419.3 | 7,569.3 |
| Portfolio investment | 17,352.9 | 17,352.3 |
| Financial derivatives other than reserves | 2,147.7 | 2,147.7 |
| Other investment | 5,106.4 | 5,098.6 |
Annual Update of the International Investment Position Accounts
The statistics in this release reflect the annual update of the U.S. net international investment position. With this update, BEA has incorporated newly available and revised source data. Previously published and revised statistics are presented in table 3.
| Agency | Data | Years affected |
|---|---|---|
| BEA | Quarterly direct investment surveys | 2014–2016 |
| Annual direct investment surveys | 2014–2016 | |
U.S. Department of the Treasury |
Aggregate Holdings of Long-Term Securities by U.S. and Foreign Residents | 2014–2016 |
| Foreign-Residents' Holdings of U.S. Securities, including Selected Money Market Instruments | 2015–2016 | |
| U.S. Ownership of Foreign Securities, including Selected Money Market Instruments | 2015–2016 | |
| Reports by Financial Institutions of Liabilities to, and Claims on, Foreign Residents by U.S. Residents | 2014–2016 | |
| Reports of Liabilities to, and Claims on, Unaffiliated Foreign Residents by U.S. Resident Non-Financial Institutions | 2014–2016 | |
| Reports of Holdings of, and Transactions in, Financial Derivatives Contracts with Foreign Residents | 2014–2016 |
Additional information on the updates to the U.S. international investment position accounts and the U.S. international transactions accounts will be provided in the July issue of the Survey of Current Business.
Next release: September 27, 2017 at 8:30 A.M. EDT
U.S. Net International Investment Position, Second Quarter 2017