
News Release
Gross Domestic Product for the U.S. Virgin Islands (USVI), 2018
Growth driven by post-disaster recovery activities
CHARLOTTE AMALIE, U.S. VIRGIN ISLANDS (December 17, 2019) -- Today, the Bureau of Economic Analysis (BEA) is releasing estimates of gross domestic product (GDP) for the U.S. Virgin Islands (USVI) for 2018, in addition to estimates of GDP by industry and compensation by industry for 2017. These estimates were developed under the Statistical Improvement Program funded by the Office of Insular Affairs (OIA) of the U.S. Department of the Interior.
Effects of Hurricanes Irma and Maria on Data Availability
The U.S. Virgin Islands suffered extensive damage from two major hurricanes in September 2017. These hurricanes affected the availability of various data sources used in the estimation of USVI GDP, including financial statements for the territorial government and its independent agencies. Several fiscal year 2017 audited financial statements (including for the central government) were not published until September 2019, and fiscal year 2018 statements are mostly unavailable as of December 2019.
Gross Domestic Product for 2018
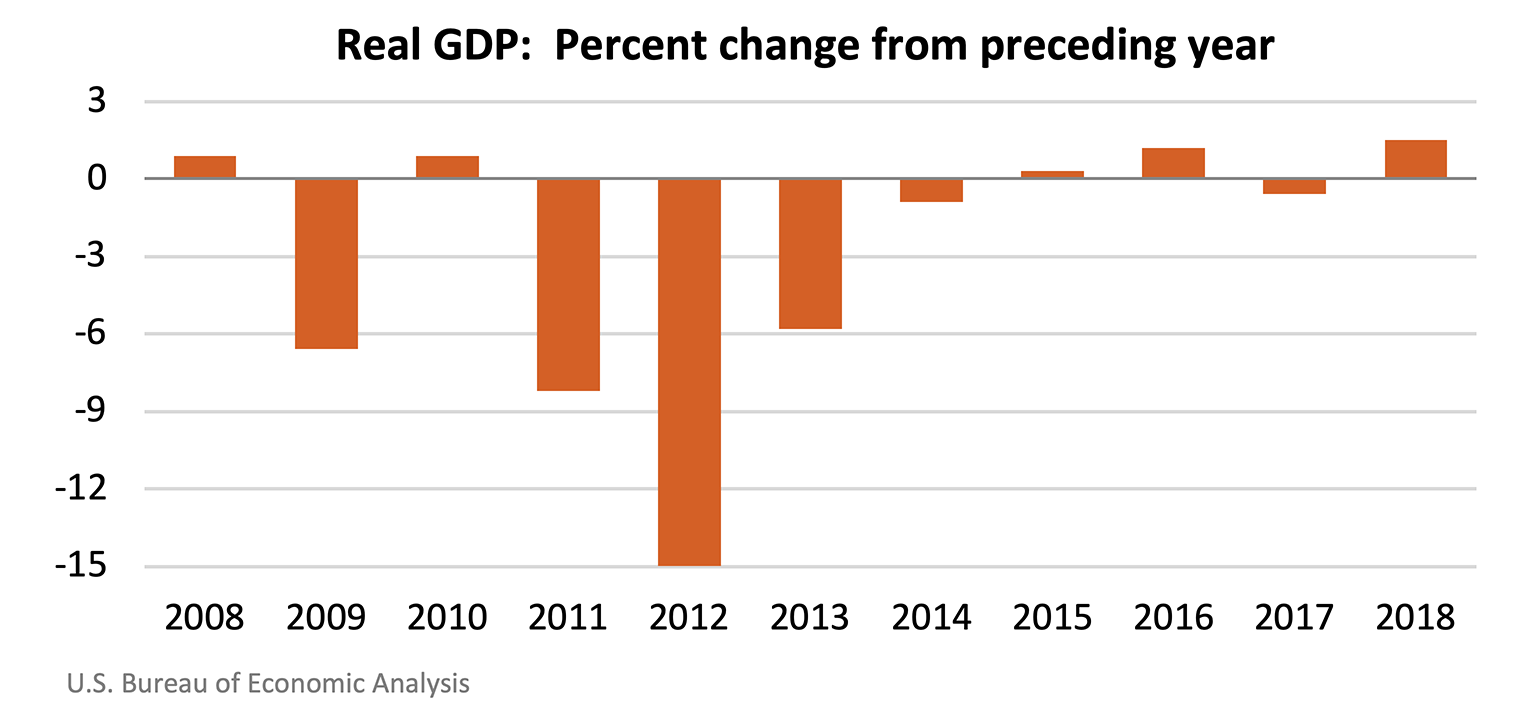
The estimates of GDP for the USVI show that real GDP—GDP adjusted to remove price changes—increased 1.5 percent in 2018 after decreasing 0.6 percent in 2017 (see Table 1.3). For comparison, real GDP for the United States (excluding the territories) increased 2.9 percent in 2018 after increasing 2.4 percent in 2017.
The growth in the USVI economy reflected increases in government spending, private fixed investment, and consumer spending (see Table 1.4). These increases were partly offset by a decrease in exports of services.
Territorial government spending increased 38.7 percent, reflecting spending on hurricane response and recovery activities that were largely funded by Federal Emergency Management Agency (FEMA) Public Assistance grants (see Table 1.3). Major projects included emergency work and longer-term repairs to the electrical system. Federal government spending also increased significantly due to disaster recovery activities, including debris removal and oil spill cleanup.
Private fixed investment increased 51.4 percent, reflecting growth in business purchases of equipment and in construction, including homes. Federal grants supported the reconstruction and major repairs of businesses and homes that were destroyed or heavily damaged by the 2017 hurricanes.
Consumer spending also increased, reflecting growth in household purchases of goods, including motor vehicles and food.
Partly offsetting these increases was a decline in exports of services, which consists primarily of spending by tourists. Total visitor arrivals decreased; the number of air visitors, who spend more on average than cruise visitors, decreased 23 percent. Arrivals by air fell significantly in the months following the hurricanes and remained below pre-hurricane levels throughout 2018.
Gross Domestic Product by Industry and Compensation by Industry for 2017
The estimates of GDP by industry show that services-producing industries and the government sector were the sources of the decrease in real GDP in 2017 (see Table 2.5). Accommodation and food services was the largest contributor to the decrease, reflecting a significant decline in tourism activity in the months following Hurricanes Irma and Maria. Government output decreased, largely due to hurricane-related disruptions in public utility and health services.
The compensation by industry estimates, which are measured in current dollars, show trends in compensation for major industries (see Table 2.6). Total compensation increased in 2017, reflecting growth in wages for goods-producing industries, including construction.
The accompanying tables present estimates for GDP and its major components, GDP by industry, and compensation by industry. Also included in this release are estimates for the major components of gross domestic income.
Revisions to GDP
Estimates for 2015 to 2017 that were released on December 17, 2018 have been revised in order to incorporate newly available and updated source data (see Table 1.7). The largest source of revision to the estimates was the incorporation of audited government financial statements for fiscal year 2017 that were not available last year. As noted in last year's release, the financial statements for fiscal year 2017 were delayed due to Hurricanes Irma and Maria. The newly available financial statements showed stronger growth in government expenditures than was originally estimated, particularly for the central government and the Water and Power Authority.
Future directions
Moving forward, an agreement between OIA and BEA will extend and improve the estimates of GDP for the USVI. The information provided by the USVI government will continue to be critical to the successful production of these estimates.
BEA will conduct a comprehensive update of GDP for the USVI next year. Estimates of GDP will be revised to reflect methodological improvements and the availability of more complete data over time, in some cases back to 2002. Information from the Census Bureau's 2017 Economic Census of Island Areas, the most comprehensive industry data available for the USVI and the other island areas, will be incorporated at this time. BEA currently plans to release these estimates, in addition to new GDP estimates for 2019, in the fall of 2020. GDP by industry and compensation by industry estimates for 2018 will also be released.