
News Release
Gross Domestic Product for Guam, 2019
Today, the Bureau of Economic Analysis (BEA) is releasing estimates of gross domestic product (GDP) for Guam for 2019, in addition to estimates of GDP by industry and compensation by industry for 2018.1 These estimates were developed under the Statistical Improvement Program funded by the Office of Insular Affairs (OIA) of the U.S. Department of the Interior.
Gross Domestic Product for 2019
The estimates of GDP for Guam show that real GDP—GDP adjusted to remove price changes—increased 2.0 percent in 2019.
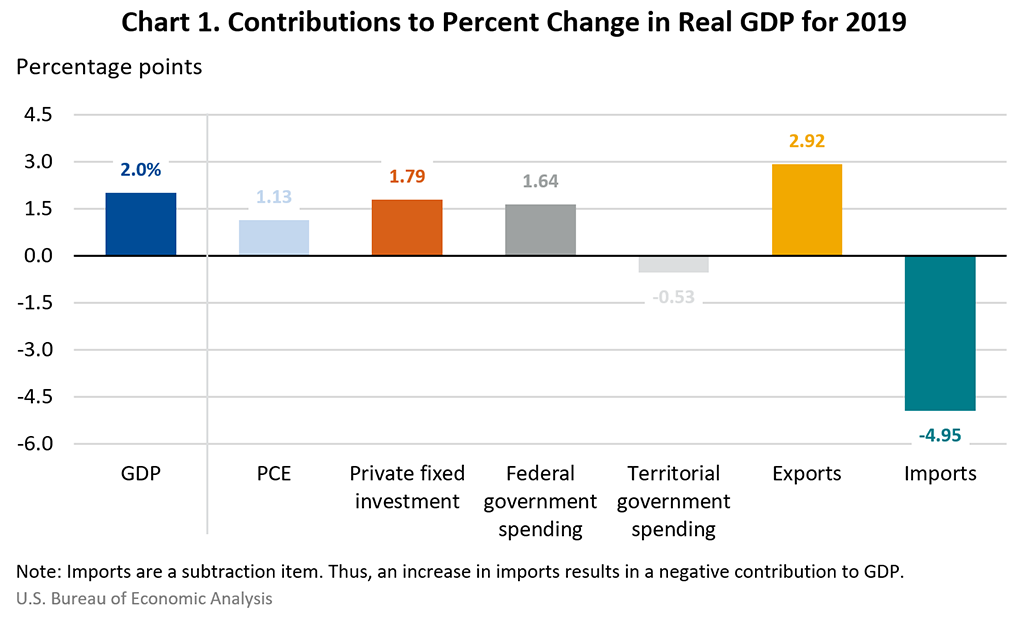
As shown in Chart 1, the increase in real GDP reflected increases in exports, private fixed investment, federal government spending, and consumer spending. These increases were partly offset by an increase in imports, which are a subtraction in the calculation of GDP, and a decline in territorial government spending.
Exports of services, which consists primarily of spending by tourists, increased 15.6 percent (see Table 1.3). This reflected a record high in visitor arrivals for the year and growth in average spending by Korean and Japanese tourists, who make up much of Guam's tourist market.
Overall, investment spending contributed positively to the economy. Spending on construction and equipment for defense and private projects increased but was partly offset by declines in territorial government investment spending. Private fixed investment grew 8.9 percent; business spending on construction increased following project delays in 2017 and 2018.
Consumer spending also increased; the eighth increase in the last 9 years. Spending increased on both goods and services, largely reflecting growth in retail trade activity and health care services, respectively (see Table 1.4).2
Gross Domestic Product by Industry and Compensation by Industry for 2018
The estimates of GDP by industry show that the government sector was the source of the decline in real GDP in 2018 (see Table 2.4). Federal and territorial government decreased, reflecting declines in employment and hours paid.
The private sector expanded in 2018, partly offsetting the decrease in the government sector. The largest contributor to private sector growth was construction, reflecting growth in private sector work on defense projects.3
The compensation by industry estimates, which are measured in current dollars, show trends in compensation for major industries (see Table 2.6). Total compensation increased in 2018, primarily reflecting growth in the private sector. Within the private sector, the largest contributors were construction and "other private."4
The accompanying tables present estimates for GDP and its major components, GDP by industry, and compensation by industry. Also included in this release are estimates for the major components of gross domestic income.
Revisions to GDP and Related Estimates
This release also includes the results of a comprehensive update of the territorial economic accounts. Comprehensive updates are typically performed every 5 years, based on the Census Bureau's every-5-years economic censuses of island areas.
With the comprehensive update, estimates for 2002 to 2018 have been revised to incorporate improvements to source data and methods, including information from:
- The U.S. Census Bureau's 2017 Economic Census of Island Areas (ECIA), which provides the most thorough and detailed statistics on the structure of the Guam economy,
- County Business Patterns data for 2017 and 2018 from the U.S. Census Bureau,
- Hospital cost reports data from the Centers for Medicare and Medicaid Services (CMS),
- BEA's U.S. national income and product accounts, and
- Guam government data sources, such as building permit data and newly available fiscal year 2019 audited government financial statements.
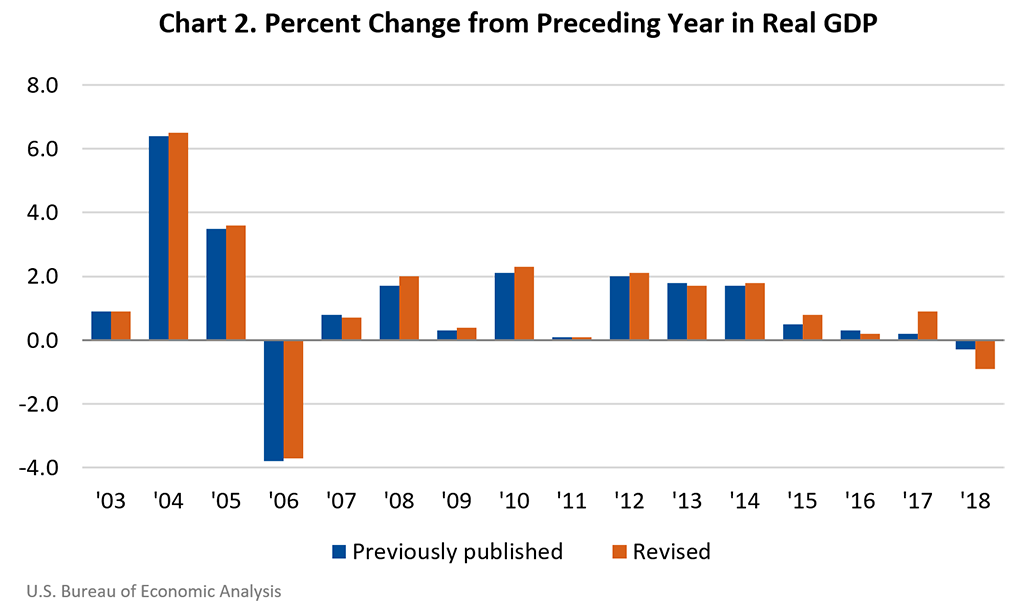
Chart 2 shows that the new estimates exhibit a pattern of inflation-adjusted GDP growth similar to the previously published estimates. However, there are notable revisions within the components of GDP, including to consumer spending and private fixed investment.
The revisions to consumer spending primarily reflect the incorporation of an improved estimation method for health care services for all years. Previously, estimates for health care services provided to households, including by hospitals, were benchmarked every 5 years to ECIA data on total revenues. Now, services provided by the government hospital are estimated for all years using annual data on net patient revenues from financial statements. For 2015 forward, CMS cost report data on net patient revenues of private sector hospitals are used for the first time.5 The cost report data replaced estimates of private sector services that had been extrapolated based on payroll data. The effect of the updated estimation method on the growth of GDP was largest for 2015 forward, as the newly incorporated CMS data showed a different pattern of growth than payroll data.
Estimates of private fixed investment were also revised, primarily reflecting the incorporation of more detailed building permit data into the annual indicators for construction activity for 2013 forward.6
The reference year for inflation-adjusted measures has been updated to 2012. This is the same reference year used in BEA's national GDP estimates.
The estimates of GDP by industry and compensation by industry have been updated to incorporate the above data sources.
Future Directions
OIA and BEA will work to extend and improve the estimates of GDP for Guam. The information provided by the Guam government will continue to be critical to the successful production of these estimates.
BEA plans to release GDP estimates for 2020 for Guam in the fall of 2021. GDP by industry and compensation by industry estimates for 2019 will be released at the same time.
1 These estimates are based on limited source data and are subject to revision.
2 Health care services include those directly financed by government social benefits such as Medicaid.
3 Construction activities performed by private companies on behalf of the government sector are reflected within private sector industry value added.
4 "Other private" includes all private sector industries not separately shown in Table 2.6, such as professional, scientific, and technical services and health care services.
5 Guam's first private sector hospital opened in July 2015. Revenues for the first half-year of operation were prorated based on 2016 data from CMS.
6 The estimates of private fixed investment are benchmarked to capital expenditures information from the 2012 ECIA.