
News Release
Gross Domestic Product, 1st Quarter 2025 (Advance Estimate)
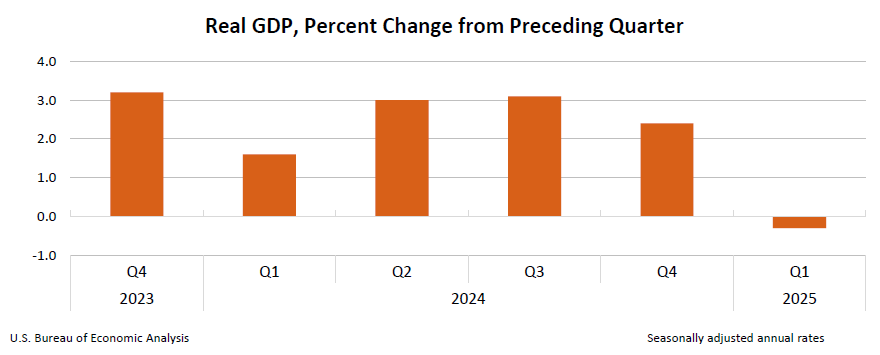
Real gross domestic product (GDP) decreased at an annual rate of 0.3 percent in the first quarter of 2025 (January, February, and March), according to the advance estimate released by the U.S. Bureau of Economic Analysis. In the fourth quarter of 2024, real GDP increased 2.4 percent.
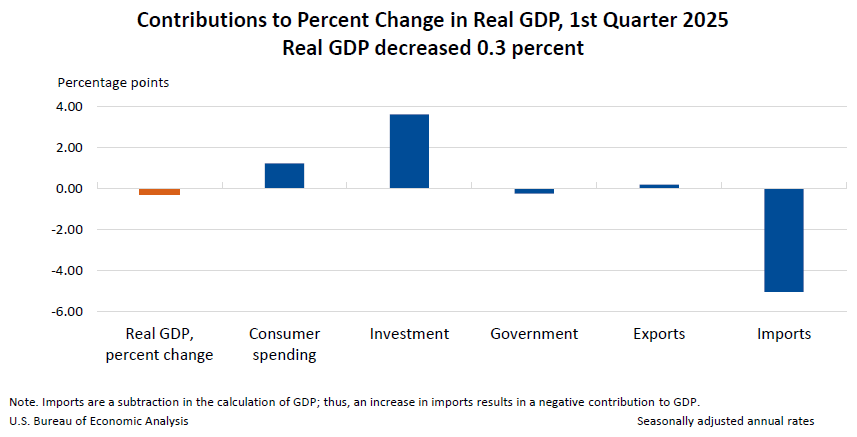
The decrease in real GDP in the first quarter primarily reflected an increase in imports, which are a subtraction in the calculation of GDP, and a decrease in government spending. These movements were partly offset by increases in investment, consumer spending, and exports. For more information, refer to the "Technical Notes" below.
Compared to the fourth quarter, the downturn in real GDP in the first quarter reflected an upturn in imports, a deceleration in consumer spending, and a downturn in government spending that were partly offset by upturns in investment and exports.
Real final sales to private domestic purchasers, the sum of consumer spending and gross private fixed investment, increased 3.0 percent in the first quarter, compared with an increase of 2.9 percent in the fourth quarter.
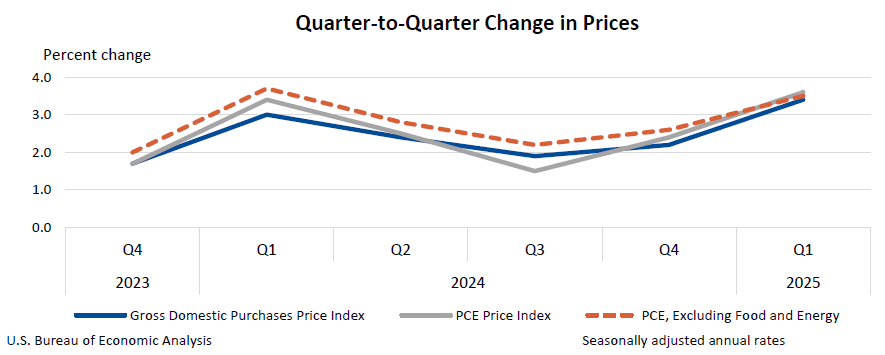
The price index for gross domestic purchases increased 3.4 percent in the first quarter, compared with an increase of 2.2 percent in the fourth quarter. The personal consumption expenditures (PCE) price index increased 3.6 percent, compared with an increase of 2.4 percent. Excluding food and energy prices, the PCE price index increased 3.5 percent, compared with an increase of 2.6 percent.
| Real GDP and Related Measures (Percent change from Q4 to Q1) |
|
|---|---|
| Advance Estimate | |
| Real GDP | -0.3 |
| Current-dollar GDP | 3.5 |
| Real final sales to private domestic purchasers | 3.0 |
| Gross domestic purchases price index | 3.4 |
| PCE price index | 3.6 |
| PCE price index excluding food and energy | 3.5 |
Next release:
May 29, 2025, at 8:30 a.m. EDT
Gross Domestic Product (Second Estimate),
Corporate Profits (Preliminary Estimate),
1st Quarter 2025
Technical Notes
Sources of change for real GDP
Real GDP decreased at an annual rate of 0.3 percent (less than 0.1 percent at a quarterly rate1) in the first quarter, primarily reflecting an increase in imports and a decrease in government spending that were partly offset by increases in investment, consumer spending, and exports.
- Exports and imports primarily reflected Census-BEA U.S. International Trade in Goods and Services data as well as the Census Advance Economic Indicators Report for March.
- Within imports, the increase primarily reflected an increase in imported goods, led by consumer goods, except food and automotive (mainly medicinal, dental, and pharmaceutical preparations, including vitamins); and by capital goods, except automotive (mainly computers, peripherals, and parts).
- Within imports of industrial supplies and materials in the National Economic Accounts (NEAs), BEA identified and removed an increase in imports of silver bars as a form of investment in the first quarter. Similar to nonmonetary gold, silver can be used for two purposes: for industrial use (as an input into the production of goods and services) and for investment (as a store of wealth and a hedge against inflation). BEA's NEAs do not treat transactions in valuables, such as nonmonetary gold and silver, as investments and therefore purchases of metals as a form of investment are not included in consumer spending, gross private domestic investment, or government spending. For more information, refer to "How are exports and imports of nonmonetary gold treated in BEA's National Economic Accounts?".
- The decrease in government spending reflected a decrease in federal government spending (led by defense consumption expenditures) that was partly offset by an increase in state and local government spending (led by compensation of employees).
- The largest contributor to the increase in investment was private inventory investment, led by an increase in wholesale trade (notably, drugs and sundries). The estimates of private inventory investment were based primarily on Census Bureau inventory book value data and a BEA adjustment in March to account for a notable increase in imports. For more information on the source data and BEA assumptions for inventories, refer to the key source data and assumptions table (available at 10 a.m.).
- The increase in consumer spending reflected increases in both services and goods. Within services, increases were widespread, led by spending on health care as well as housing and utilities. Within goods, an increase in nondurable goods was partly offset by a decrease in durable goods.
More information on the source data and BEA assumptions that underlie the first-quarter estimate is shown in the key source data and assumptions table (available at 10 a.m.).
Impact of California Wildfires on first-quarter 2025 estimates
In January 2025, a series of wildfires burned across Southern California, primarily impacting Los Angeles County. These disasters disrupted consumer and business activities and prompted emergency services and remediation activities. The responses to this disaster are included, but not separately identified, in the source data that BEA uses to prepare the estimates of GDP; consequently, it is not possible to estimate the overall impact of the California wildfires on first-quarter GDP. The destruction of fixed assets, such as residential and nonresidential structures, does not directly affect GDP or personal income. BEA estimates disaster losses in NIPA table 5.1, "Saving and Investment." BEA's preliminary estimates show that the California wildfires resulted in losses of $34.0 billion in privately owned fixed assets ($136.0 billion at an annual rate) and $11.0 billion in state and local government-owned fixed assets ($44.0 billion at an annual rate).
For additional information, refer to "How are the measures of production and income in the national accounts affected by a disaster?" and "How are the fixed assets accounts (FAAs) and consumption of fixed capital (CFC) impacted by disasters?".
1 Percent changes in quarterly seasonally adjusted series are displayed at annual rates, unless otherwise specified. For more information, refer to the FAQ Why does BEA publish percent changes in quarterly series at annual rates?.