
News Release
Gross Domestic Product by State and Personal Income by State, 2nd Quarter 2025 and Personal Consumption Expenditures by State, 2024
Today, the U.S. Bureau of Economic Analysis released new quarterly statistics on gross domestic product and personal income for all 50 states and the District of Columbia for the second quarter of 2025 (April, May, and June), along with new annual statistics on state personal consumption expenditures for 2024.
Gross domestic product (GDP) highlights
Real GDP increased in 48 states in the second quarter of 2025. The percent change at an annual rate in real GDP was 3.8 percent nationally, with state-level changes ranging from a 7.3 percent increase in North Dakota to a 1.1 percent decline in Arkansas. In the District of Columbia, real GDP growth was unchanged.
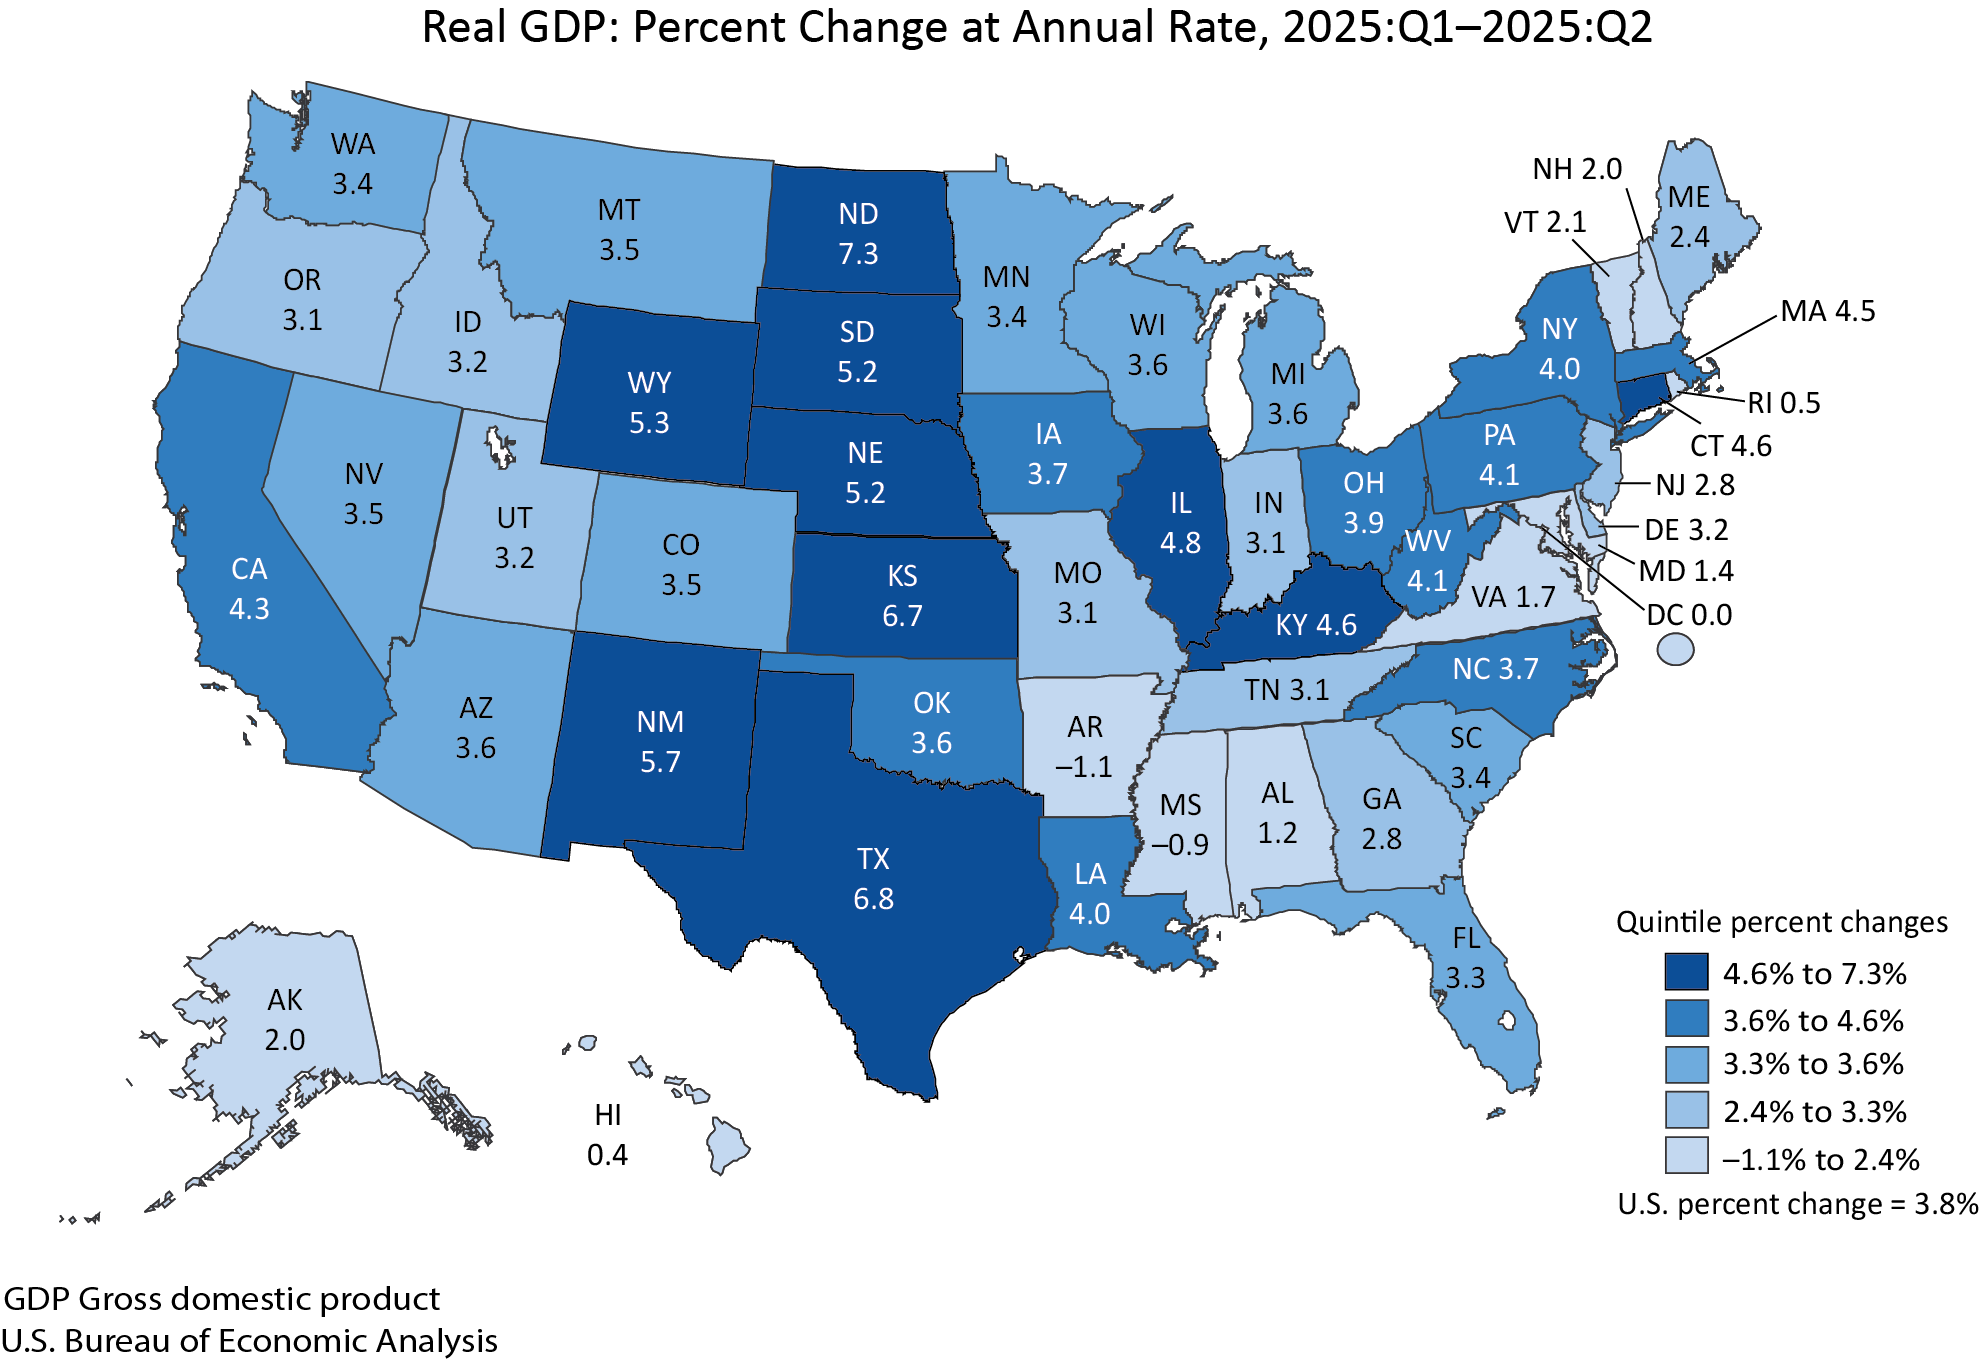
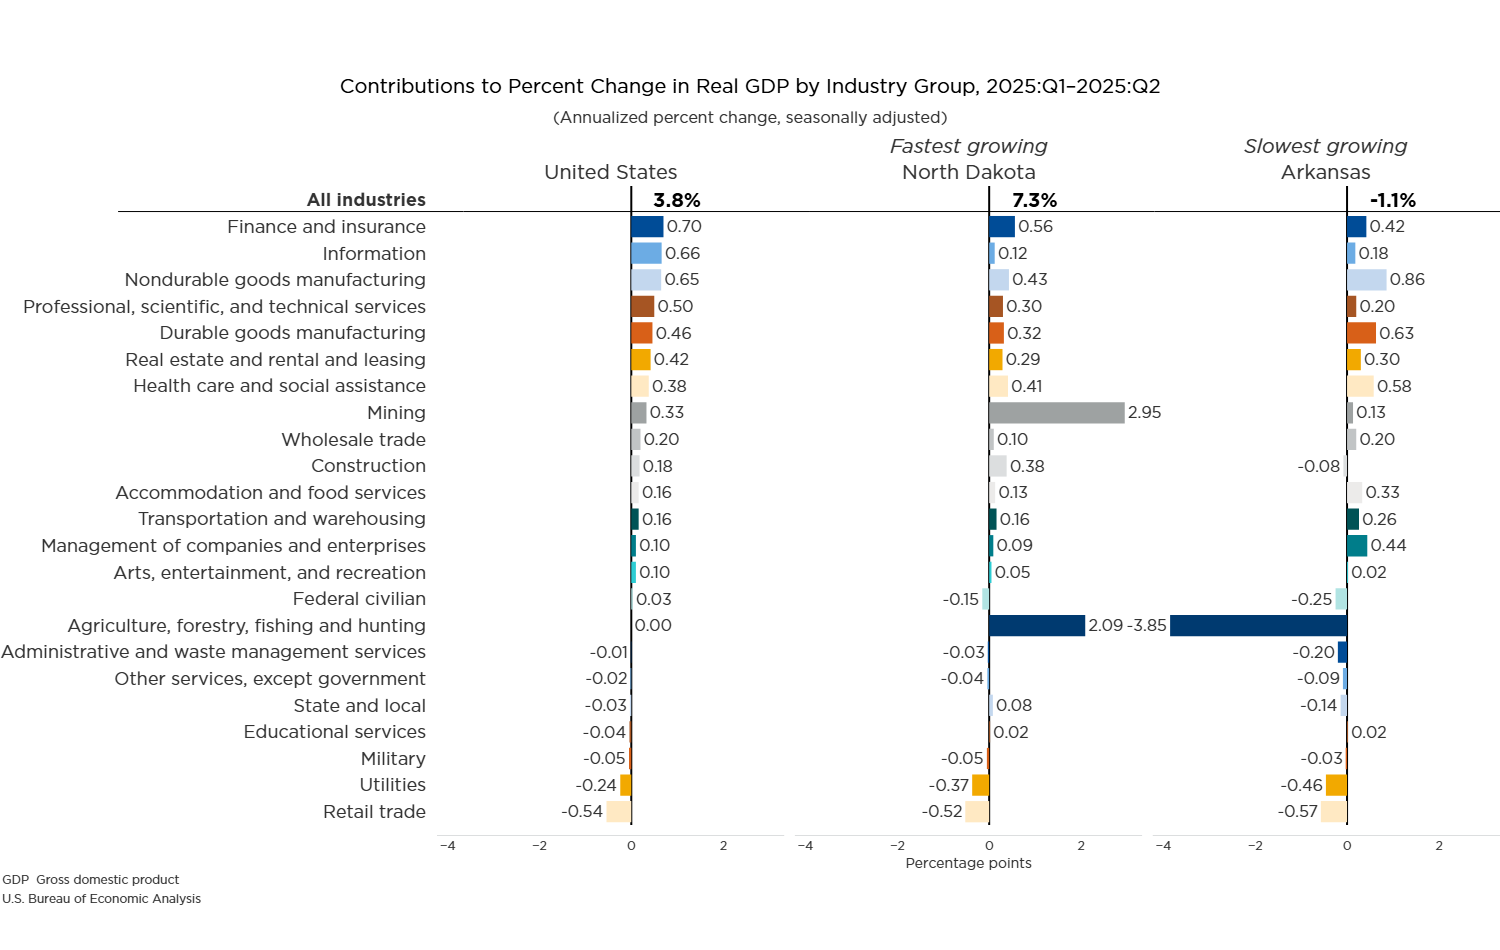
In the second quarter of 2025, real GDP increased in 15 of the 23 industry groups for which BEA prepares quarterly state estimates. Finance and insurance, information, and nondurable-goods manufacturing were the leading contributors to growth in real GDP nationally. These industries were also the leading contributors to real GDP growth in half the states. Two other industries that impacted real GDP growth in several states were agriculture, forestry, fishing, and hunting and mining, quarrying, and oil and gas extraction.
- Mining, quarrying, and oil and gas extraction increased in 45 states and was the leading contributor to growth in eight states including North Dakota, Texas, New Mexico, and Wyoming, the states with the first-, second-, fourth-, and fifth-largest increases in real GDP, respectively.
- Agriculture, forestry, fishing, and hunting increased in 27 states and was the leading contributor to growth in six states including Kansas, the state with the third-largest increase in real GDP. In contrast, this industry was the leading offset to growth in six states including Arkansas and Mississippi, the two states where real GDP declined.
Personal income highlights
Personal income increased in all 50 states and the District of Columbia in the second quarter of 2025. The percent change at an annual rate in current-dollar personal income was 5.5 percent nationally, with state-level changes ranging from a 10.4 percent increase in Kansas to a 0.9 percent increase in Arkansas. In the District of Columbia, personal income increased by 4.9 percent.
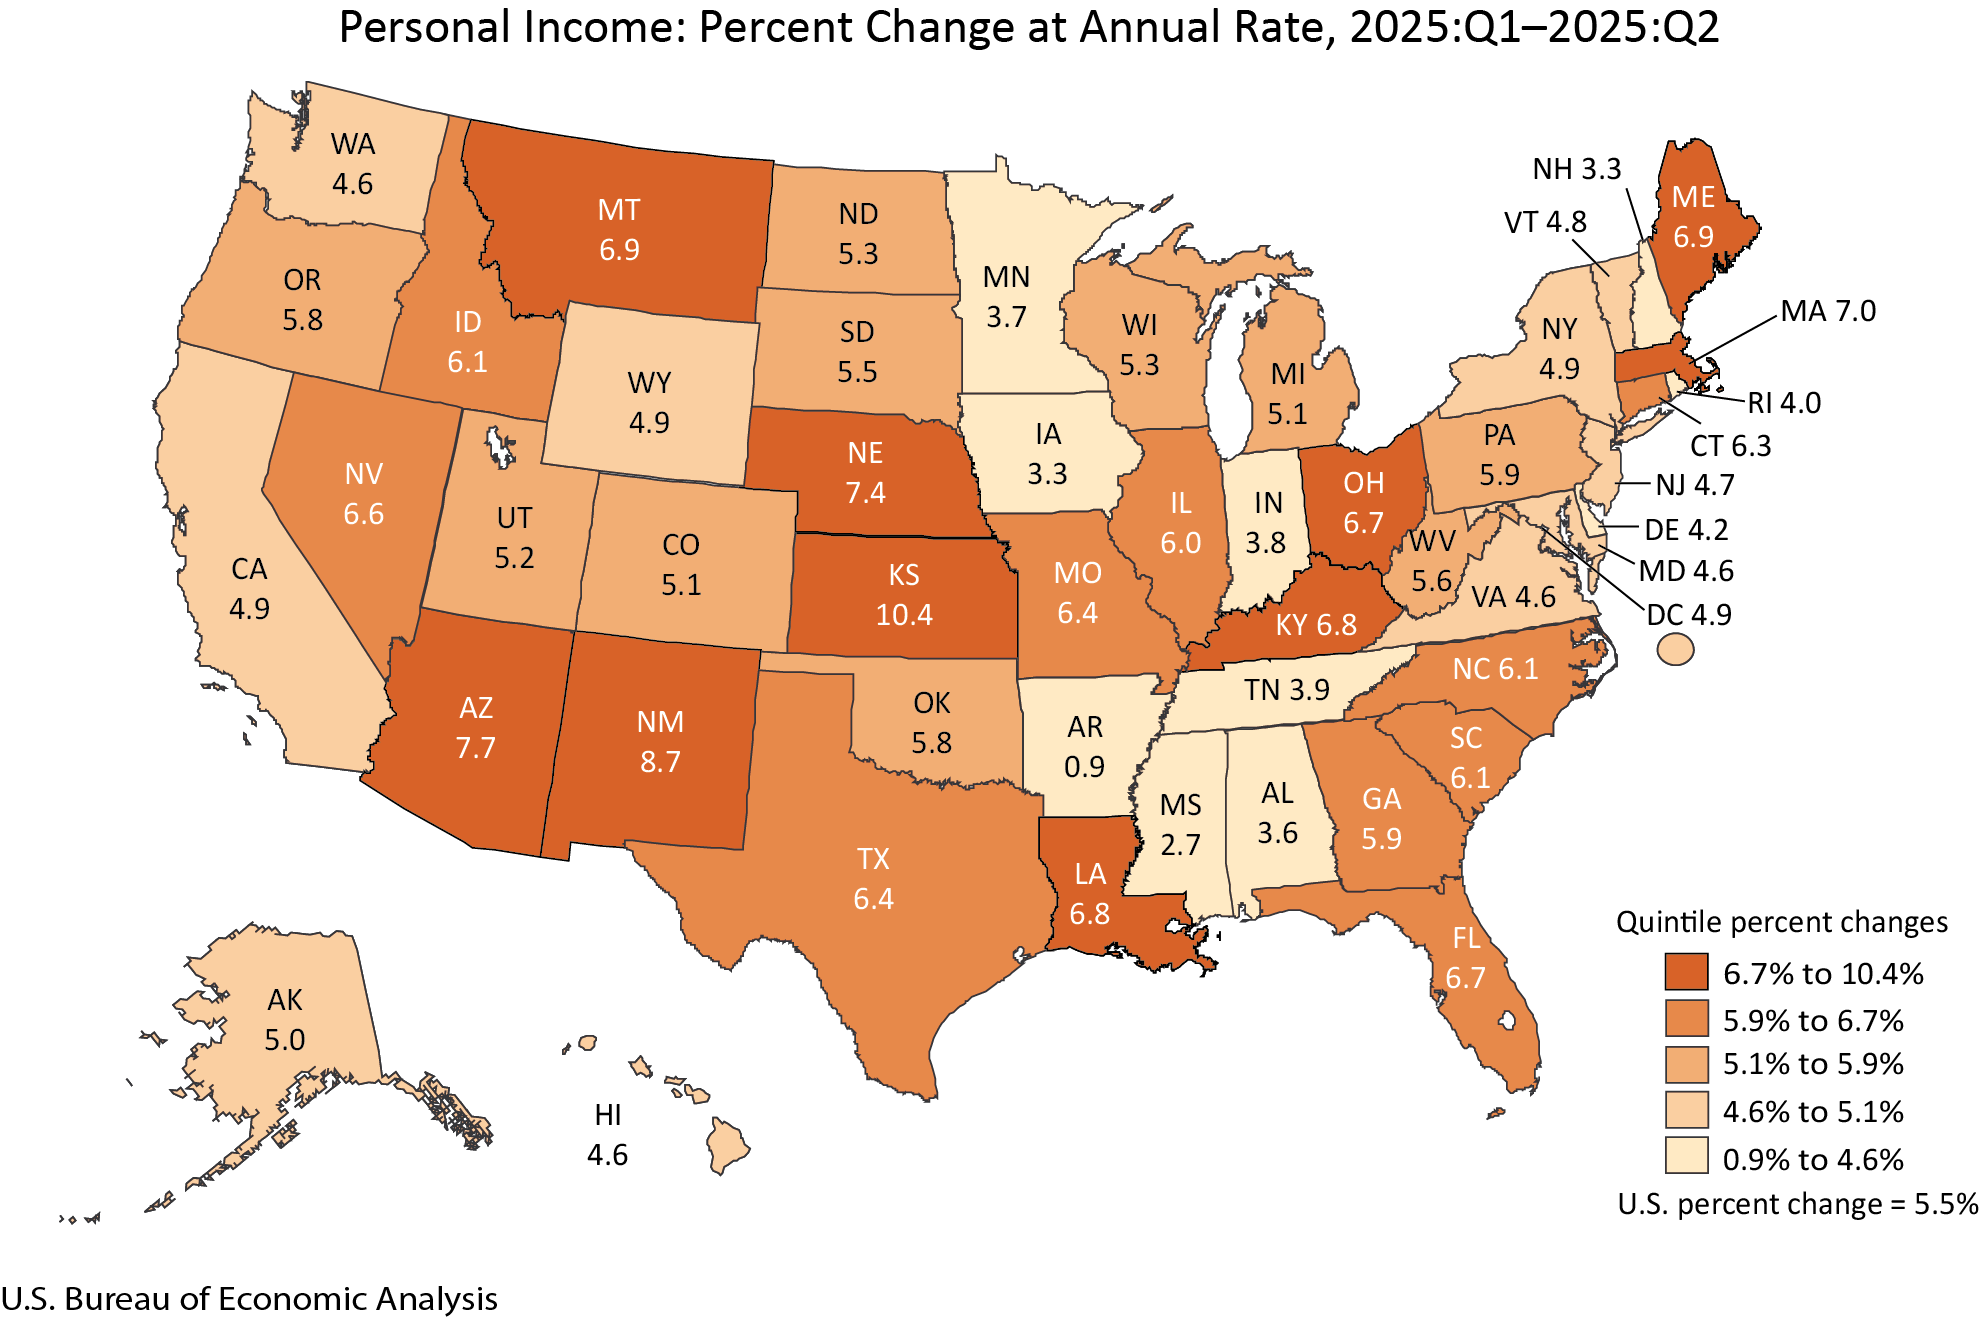
In the second quarter of 2025, all components of personal income—earnings, transfer receipts, and property income (dividends, interest, and rent)—contributed to the increase in personal income nationally. Each component increased in all 50 states and the District of Columbia except for earnings, which declined in Arkansas and Mississippi.
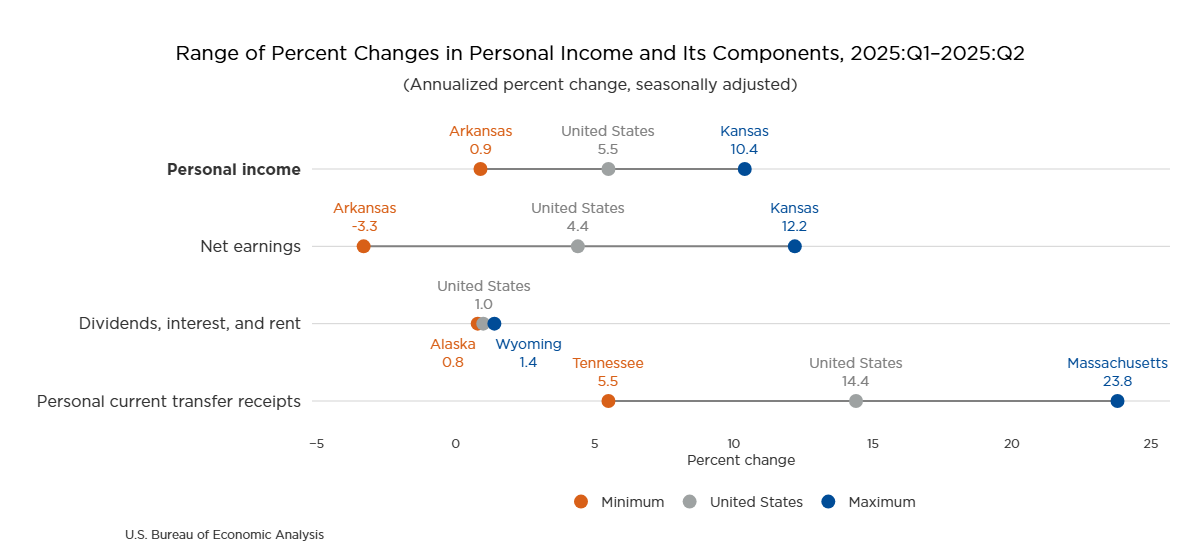
- Earnings increased 4.4 percent nationally, with state-level changes in earnings ranging from a 12.2 percent increase in Kansas to a 3.3 percent decrease in Arkansas. Earnings was the largest contributor to growth in personal income in 21 states and the District of Columbia.
- Transfer receipts increased 14.4 percent nationally, with state-level changes in transfer receipts ranging from a 23.8 percent increase in Massachusetts to a 5.5 percent increase in Tennessee. Transfer receipts was the largest contributor to growth in personal income in 29 states. The increase in transfer receipts was due in part to retroactive payments to Social Security beneficiaries under the Social Security Fairness Act of 2024.
- Property income increased 1.0 percent nationally, with state-level changes in property income ranging from a 1.4 percent increase in Wyoming to a 0.8 percent increase in Kansas, Illinois, Alaska, Iowa, and Louisiana.
Personal consumption expenditures (PCE) highlights
PCE increased in all 50 states and the District of Columbia in 2024. Current-dollar PCE increased 5.6 percent nationally, with state-level changes in PCE ranging from a 7.0 percent increase in Florida to a 4.3 percent increase in Mississippi. In the District of Columbia, PCE increased 6.6 percent.
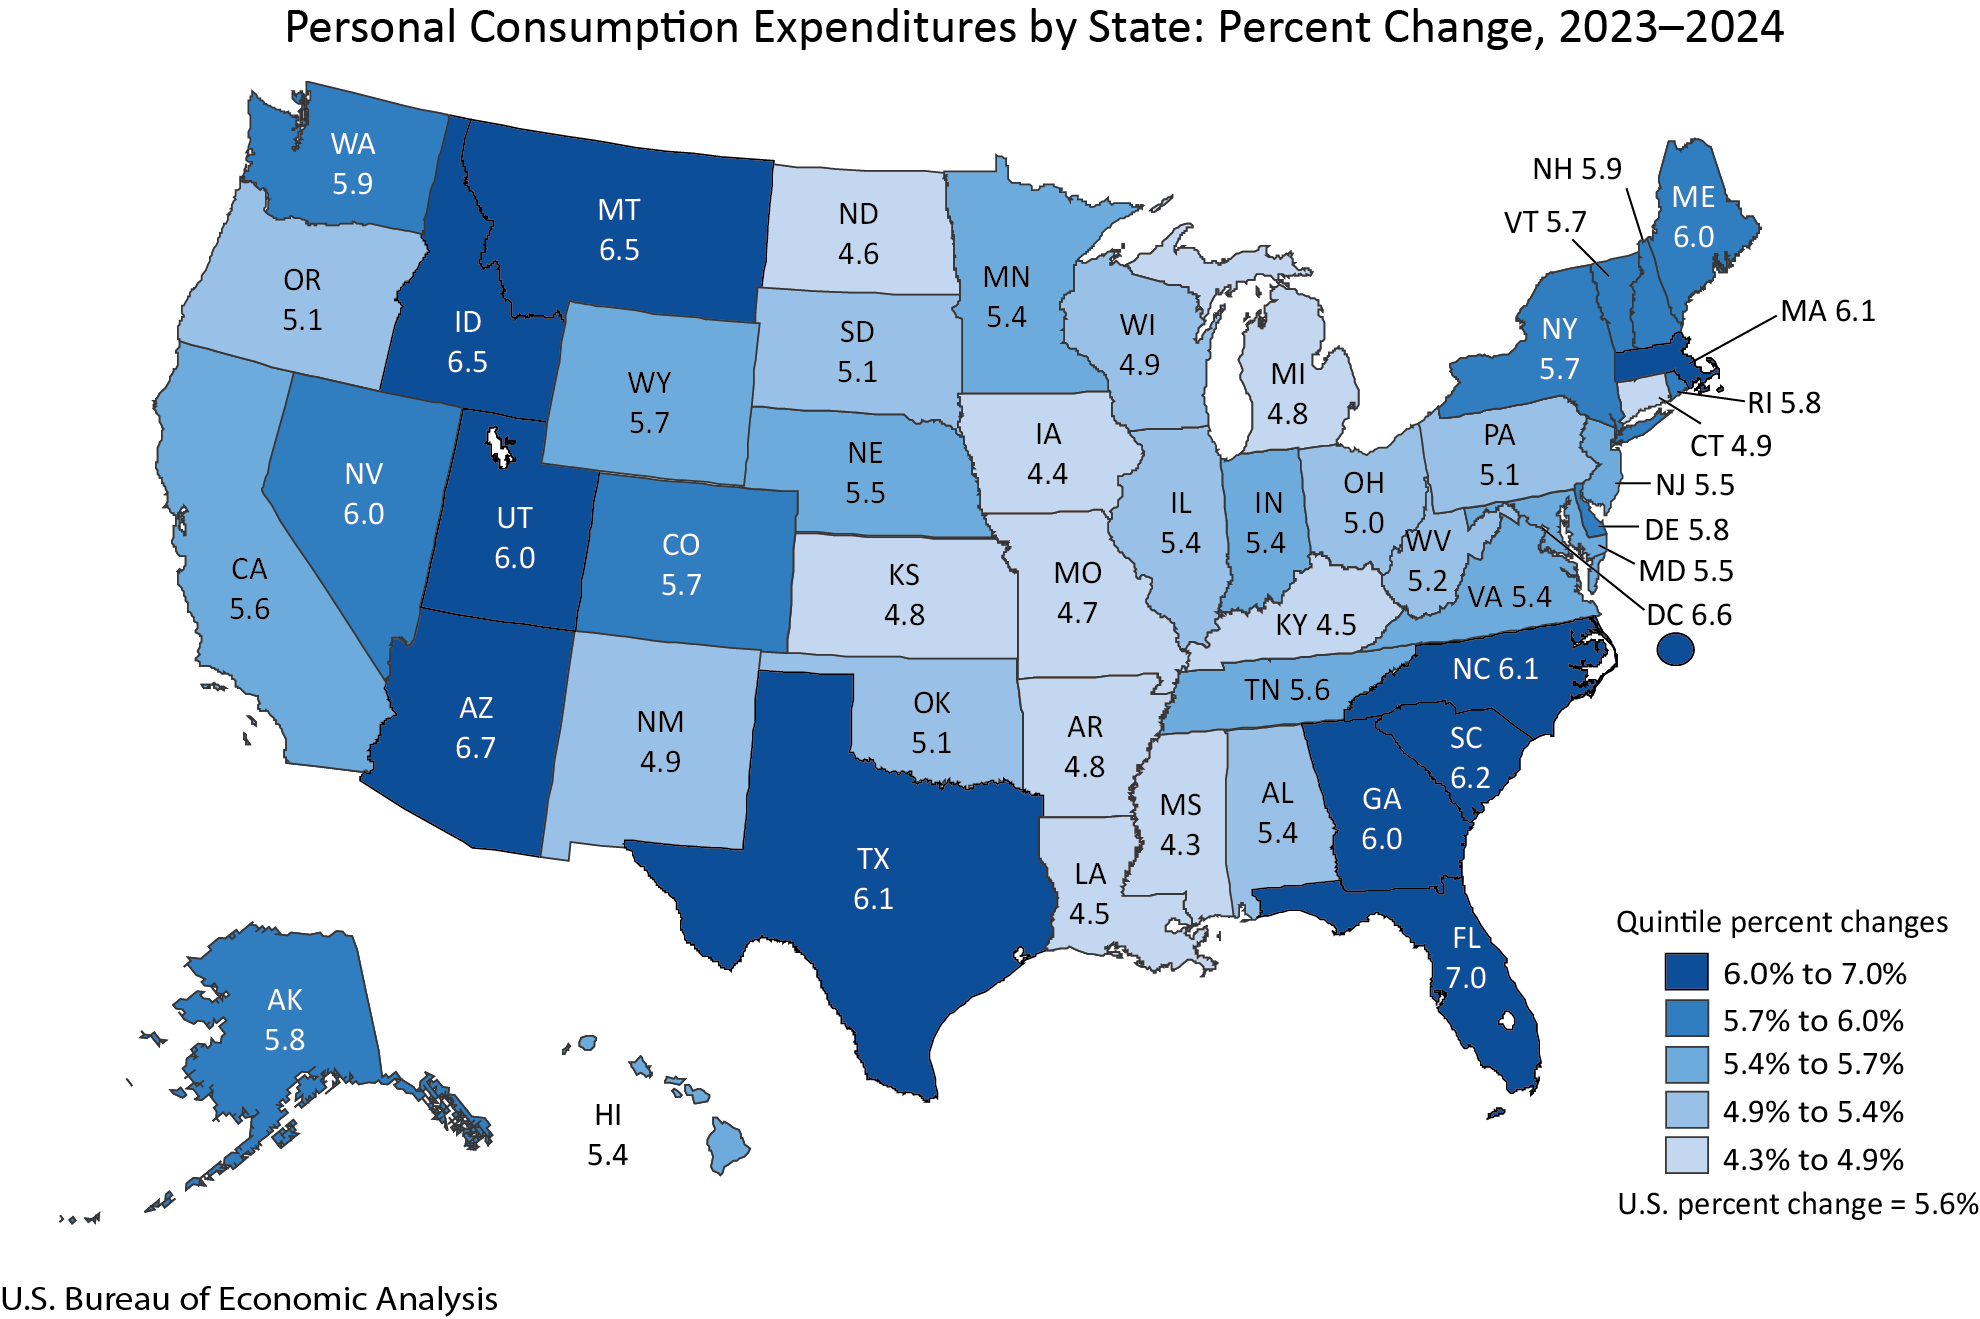
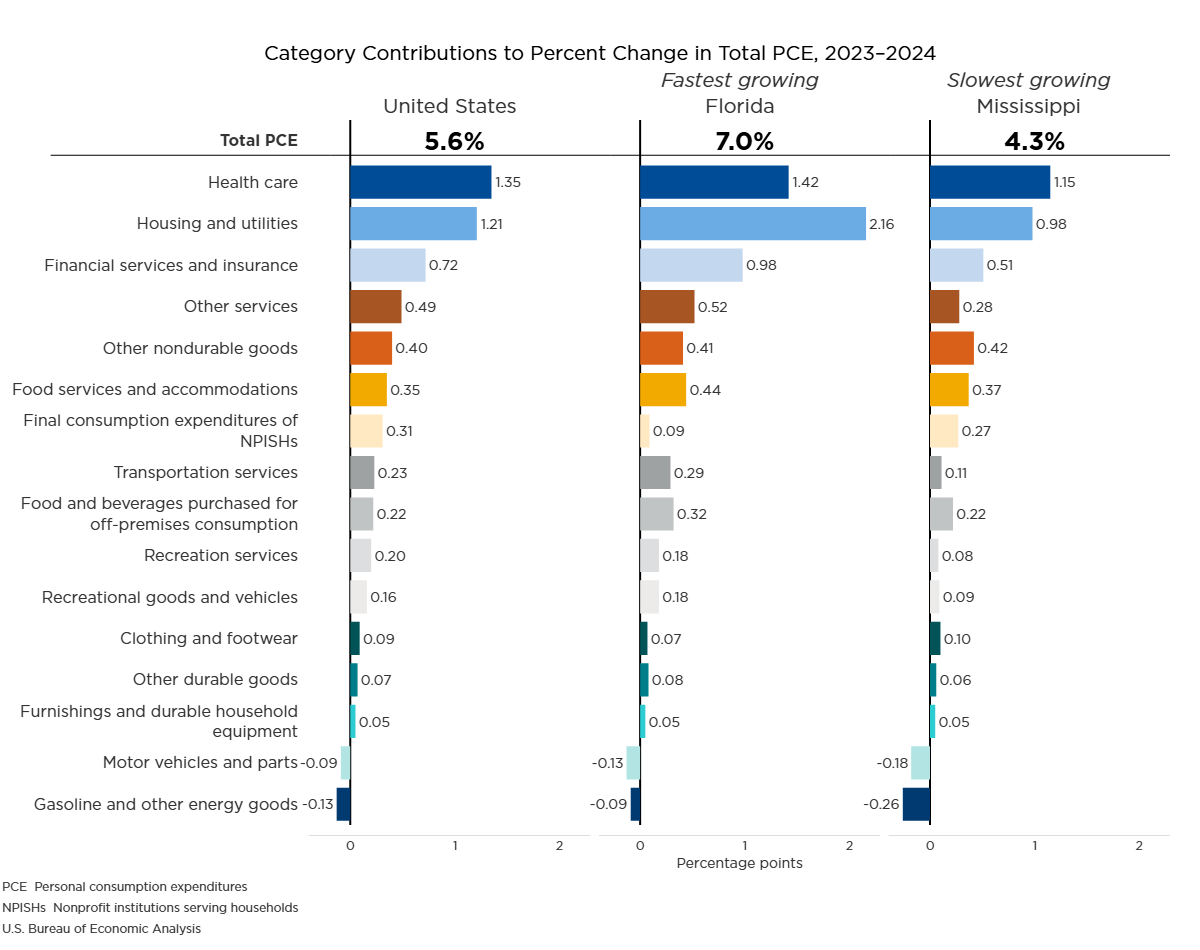
In 2024, PCE increased in 14 of the 16 major categories for which BEA prepares estimates. Health care and housing and utilities were the largest contributors to the increase in PCE nationally. They were also the leading contributors to PCE growth in 49 states. PCE decreased in two categories, gasoline and other energy goods and motor vehicles and parts. These two categories were the largest subtractions to growth in 49 states and the District of Columbia.
- Health care increased 8.3 percent nationally and was the largest contributor to state PCE growth in 34 states.
- Housing and utilities increased 6.8 percent nationally and was the largest contributor to growth in 15 states including Florida, the state with the largest increase in PCE, and the District of Columbia.
- Gasoline and other energy goods decreased 5.2 percent nationally and was the largest subtraction to growth in 37 states including Mississippi, the state with the smallest increase in PCE.
Update of state statistics
The estimates for the second quarter of 2025 incorporate the results of BEA's annual updates of GDP and personal income by state that are also being released today. The annual estimates of GDP and personal income by state from 2020 to 2024, PCE by state from 2020 to 2023, and quarterly estimates of GDP and personal income by state from the first quarter of 2020 through the first quarter of 2025 were revised. This update incorporates new and revised source data that are more complete and more detailed than previously available and updates to seasonal factors and aligns the states with the annual update of the National Income and Product Accounts and the GDP by industry statistics released on September 25, 2025. An upcoming article in the Survey of Current Business will describe the results.
New combined state news release
BEA published quarterly GDP and personal income by state along with annual PCE by state in a single news release today for the first time. This combined release provides a fuller picture of the economies of all states and the District of Columbia and replaces the publication of two separate releases issued on different days.
Changes in the presentation of tables
BEA’s ongoing modernization and streamlining of news release packages includes changes in the presentation of tables starting with today’s release of GDP, personal income, and PCE by state.
Data previously published as tables within the quarterly and annual news releases of GDP, personal income, and PCE by state are updated and available simultaneously with today’s release in BEA’s online Interactive Data Application. However, tables are no longer included with the body of the news release. This reduces duplication, increases efficiency, and points data users directly to BEA’s most complete and flexible data tables, via links in the release. These customizable tables include full time series and can be downloaded as PDFs, in Excel, or in CSV format.
Related Interactive Data Tables
For the second-quarter 2025 GDP and personal income by state statistics and the annual 2024 PCE by state statistics highlighted in this release, as well as historical time series for these estimates, see the below data tables in BEA’s Interactive Data Application.
GDP by state
Table SQGDP1. Quarterly GDP by State—Percent Change at Annual Rates From Preceding Period
Table SQGDP11. Industry Contributions to Percent Change in Real GDP by State
Personal income by state
Table SQINC1. Quarterly Personal Income by State—Percent Change at Annual Rates From Preceding Period
Table SQINC12. Personal Income Change by Component
PCE by state
Table SAPCE1. Annual PCE by State—Percent Change From Preceding Period
Table SAPCE5. Spending Category Contributions to Percent Change in PCE by State
Note. With the release of third-quarter 2025 GDP by state and personal income by state statistics on December 22, 2025, the second-quarter data will be superseded and can then be accessed in BEA’s Data Archive
Next release: December 22, 2025, at 10:00 a.m. EST
Gross Domestic Product by State and Personal Income by State, 3rd Quarter 2025