
News Release
U.S. International Transactions, 2nd Quarter 2025
Current-Account Deficit Narrowed by 42.9 Percent in Second Quarter
Current-Account Balance (Table 1)
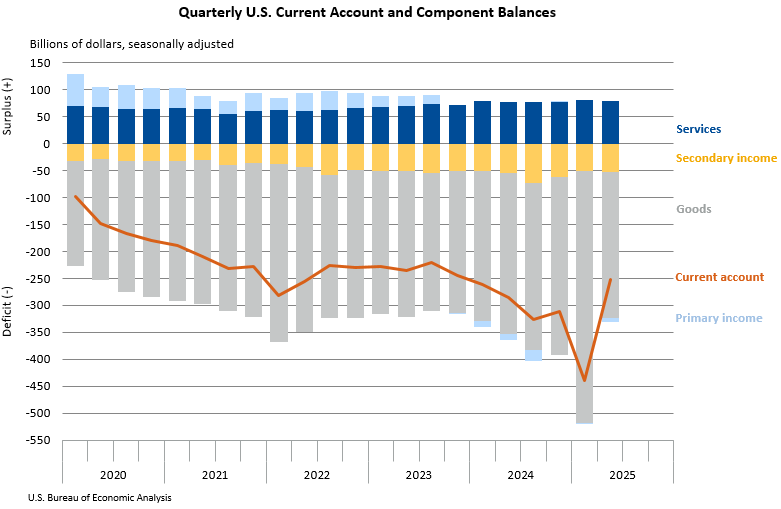
The U.S. current-account deficit, which reflects the combined balances on trade in goods and services and income flows between U.S. residents and residents of other countries, narrowed by $188.5 billion, or 42.9 percent, to $251.3 billion in the second quarter of 2025, according to statistics released today by the U.S. Bureau of Economic Analysis. The revised first-quarter deficit was $439.8 billion.
The second-quarter deficit was 3.3 percent of current-dollar gross domestic product, down from 5.9 percent in the first quarter.
The $188.5 billion narrowing of the current-account deficit in the second quarter primarily reflected a reduced deficit on goods.
Current-Account Transactions (Tables 1–5)
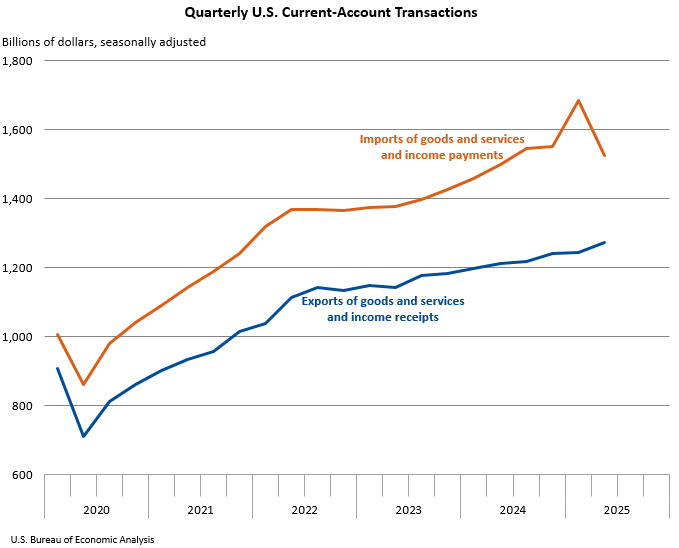
Exports of goods and services to, and income received from, foreign residents increased $28.6 billion to $1.27 trillion in the second quarter. Imports of goods and services from, and income paid to, foreign residents decreased $159.9 billion to $1.53 trillion.1
Trade in goods (table 2)
Exports of goods increased $11.3 billion to $550.2 billion, reflecting an increase in nonmonetary gold. The increase was partly offset by a decrease in industrial supplies and materials. Imports of goods decreased $184.5 billion to $820.2 billion, reflecting decreases in nonmonetary gold, in consumer goods, and in industrial supplies and materials. (See "Additional Information" for a definition of nonmonetary gold under "Goods.")
Trade in services (table 3)
Exports of services increased $2.1 billion to $301.6 billion, reflecting increases in financial services and in charges for the use of intellectual property. These increases were partly offset by a decrease in government goods and services. Imports of services increased $2.8 billion to $222.0 billion, reflecting increases in "other business services," mainly technical, trade-related, and other business services, and in telecommunications, computer, and information services. These increases were partly offset by a decrease in transport.
Primary income (table 4)
Receipts of primary income (earned income) increased $17.8 billion to $376.1 billion, and payments of primary income increased $22.8 billion to $383.8 billion. The increases in both receipts and payments reflected increases in direct and portfolio investment income.
Secondary income (table 5)
Receipts of secondary income (current transfers) decreased $2.6 billion to $45.9 billion, reflecting a decrease in private transfers. Payments of secondary income decreased $1.0 billion to $99.2 billion, reflecting a decrease in general government transfers.
Capital-Account Transactions (Table 1)
Capital-transfer receipts decreased $8.9 billion to $16 million in the second quarter. First-quarter transactions reflected receipts from foreign insurance companies for losses resulting from wildfires in Southern California. (See "How do losses recovered from foreign insurance companies following natural or man-made disasters affect foreign transactions, the current account balance, and net lending or net borrowing?" for information on transactions associated with wildfires, hurricanes, and other disasters.) Capital-transfer payments decreased $0.1 billion to $1.9 billion.
Financial-Account Transactions (Tables 1, 6, 7, and 8)
Net financial-account transactions were −$406.9 billion in the second quarter, reflecting net U.S. borrowing from foreign residents.
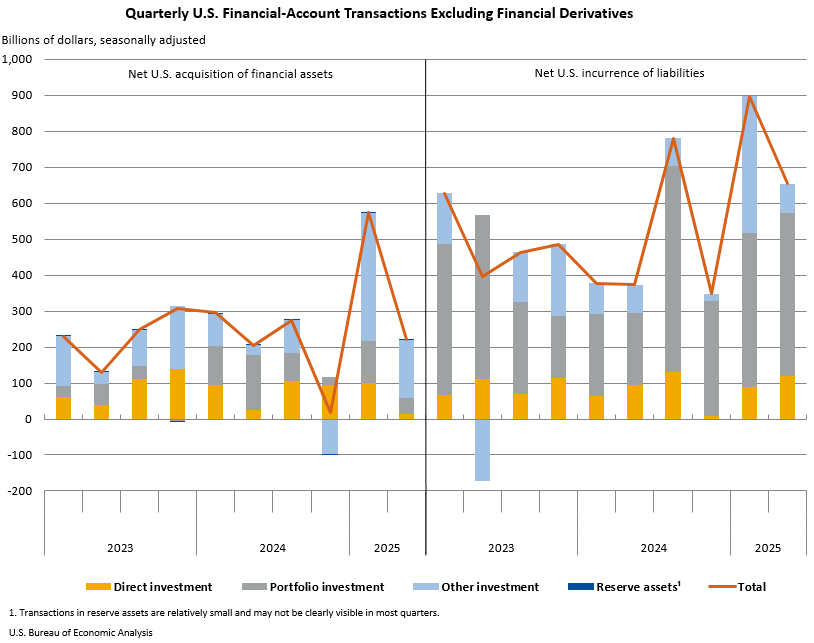
Financial assets (tables 1, 6, 7, and 8)
Second-quarter transactions increased U.S. residents' foreign financial assets by $220.6 billion. Transactions increased "other investment assets" by $161.8 billion; portfolio investment assets by $45.2 billion; direct investment assets by $13.1 billion; and reserve assets by $0.6 billion.
Liabilities (tables 1, 6, 7, and 8)
Second-quarter transactions increased U.S. liabilities to foreign residents by $653.4 billion. Transactions increased portfolio investment liabilities by $452.5 billion; direct investment liabilities by $120.8 billion; and "other investment liabilities" by $80.1 billion.
Financial derivatives (table 1)
Net transactions in financial derivatives were $25.8 billion in the second quarter, reflecting net U.S. lending to foreign residents.
Updates to First-Quarter 2025 International Transactions Accounts Balances [Billions of dollars, seasonally adjusted] | ||
|---|---|---|
| Preliminary estimates | Revised estimates | |
| Current-account balance | –450.2 | –439.8 |
| Goods balance | –466.0 | –465.8 |
| Services balance | 75.4 | 80.3 |
| Primary income balance | –7.6 | –2.6 |
| Secondary income balance | –52.0 | −51.7 |
| Net financial-account transactions | −299.5 | −303.5 |
| U.S. Bureau of Economic Analysis | ||
New Combined News Release and Changes in the Presentation of Tables
Beginning in March 2026, BEA will publish quarterly U.S. international transactions and the U.S. international investment position in a single news release. This combined quarterly release will provide a broader view of U.S. participation in the global economy and will replace the publication of two separate releases issued on different days, accelerating the availability of international investment position statistics.
In addition, as part of BEA's ongoing modernization and streamlining of news release packages, the statistics currently published as tables within the releases will not be included in the body of the release but will be available in BEA's Interactive Data Application. This will reduce duplication, increase efficiency, and point data users directly to BEA's most complete and flexible data tables via links in the release. These customizable tables include full time series and can be downloaded as PDFs, in Excel, or in CSV format.
Next release: December 18, 2025, at 8:30 a.m. EST
U.S. International Transactions, 3rd Quarter 2025