
News Release
Direct Investment by Country and Industry, 2025
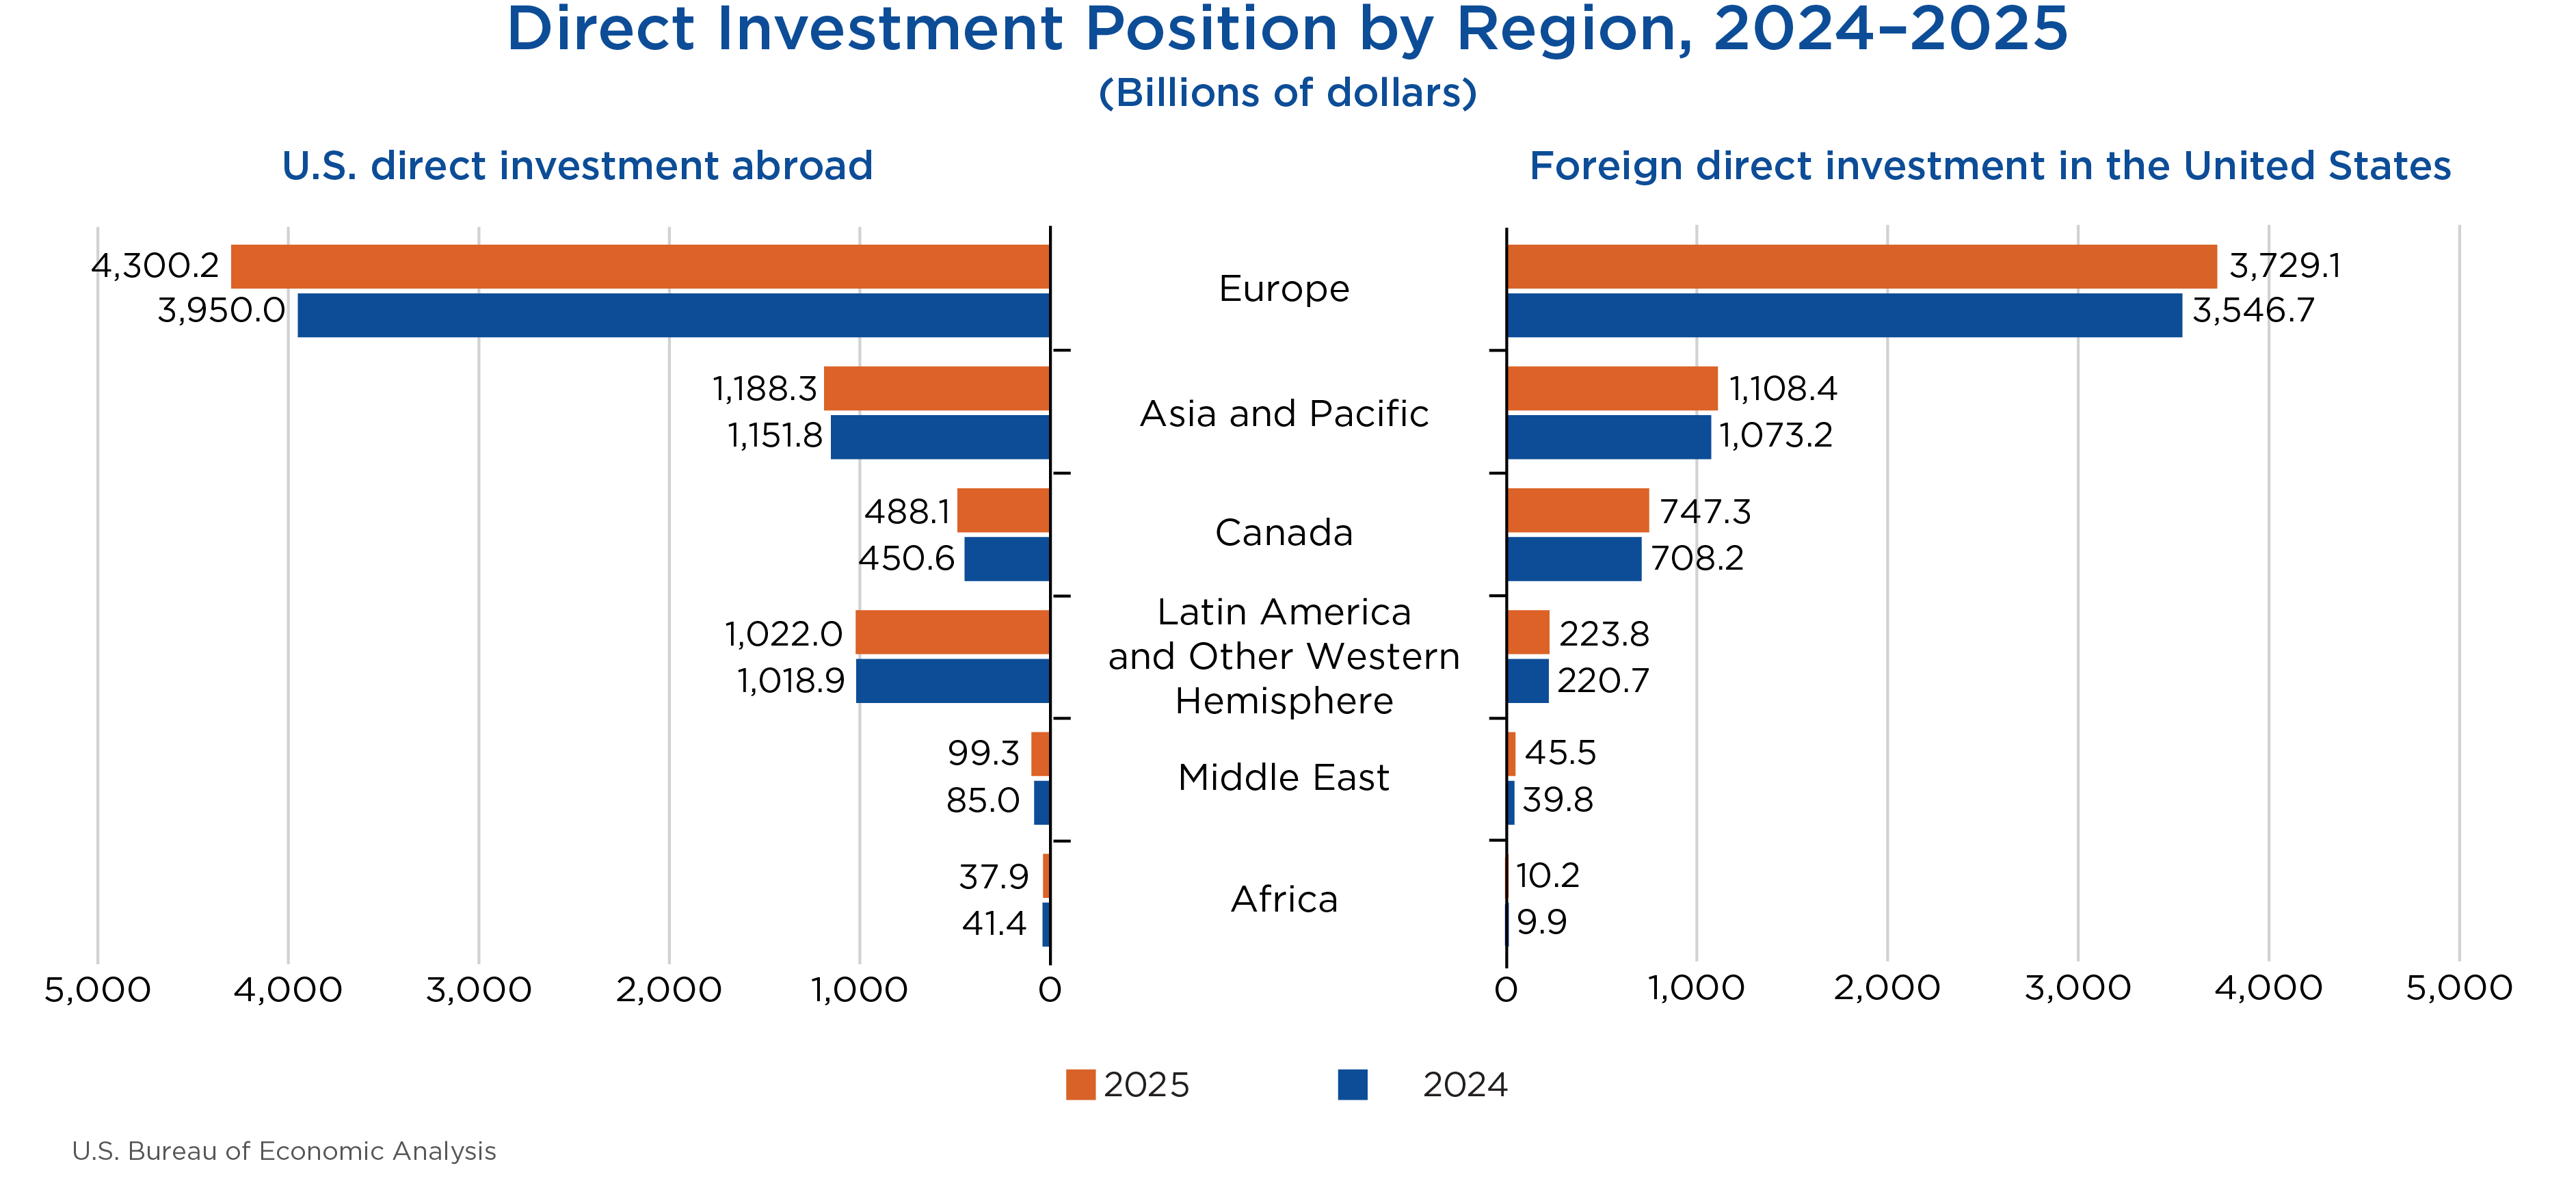
The U.S. direct investment abroad position, or cumulative level of investment, increased $438.1 billion to $7.14 trillion at the end of 2025, according to statistics released today by the U.S. Bureau of Economic Analysis. The increase was led by a $350.2 billion increase in the position in Europe, primarily in the United Kingdom and Luxembourg. By industry, manufacturing had the largest increase, led by chemical manufacturing.
The foreign direct investment in the United States position increased $266.0 billion to $5.86 trillion at the end of 2025. The increase was led by a $182.4 billion increase in the position from Europe. The largest increase in position was from German multinationals, with a $49.0 billion increase, and the second-largest increase in position was from Canadian multinationals, with a $39.2 billion increase. By industry, manufacturing increased the most, led by electrical equipment and components manufacturing.
U.S. direct investment abroad
U.S. multinational enterprises (MNEs) invest in nearly every country, but their investment in affiliates in five countries accounted for more than half of total U.S. direct investment abroad in 2025. The position was largest in the United Kingdom ($1,114.7 billion), followed by the Netherlands ($1,044.0 billion), Luxembourg ($645.3 billion), Ireland ($511.9 billion), and Canada ($488.1 billion).
By industry of the directly owned foreign affiliate, investment was largest in holding companies, which accounted for 45.8 percent of the overall position abroad in 2025. Manufacturing affiliates were second, with 15.9 percent, and finance and insurance affiliates were third, with 13.5 percent, of U.S. investment.
By industry of the U.S. parent, investment by manufacturing MNEs accounted for 50.2 percent of the position, followed by MNEs in finance and insurance (15.8 percent).
U.S. MNEs earned income of $660.1 billion in 2025 on their cumulative investment abroad, an 11.1 percent increase from 2024. Income grew the most in holding companies, increasing $40.0 billion. Income in finance and insurance fell by $6.3 billion compared to 2024.
Foreign direct investment in the United States
By country of the foreign parent, four countries accounted for more than half of total foreign direct investment in the United States in 2025. Japan was the top investing country with a position of $776.3 billion, followed by the Netherlands ($751.8 billion), Canada ($747.3 billion), and the United Kingdom ($738.3 billion).
By country of the ultimate beneficial owner (UBO), the entity at the top of the global ownership chain, Japan was the top investing country in terms of position at the end of 2025, with $827.1 billion. Canada ($819.8 billion) was second, and Germany ($706.2 billion) was third. On the UBO basis, investment from the Netherlands and Luxembourg was much lower than by the country of foreign parent, indicating that much of the investment from foreign parents in these countries was ultimately owned by investors in other countries.
By industry, foreign direct investment in the United States was concentrated in the U.S. manufacturing sector, which accounted for 42.8 percent of the total position. Of the $2.51 trillion foreign investment position in U.S. manufacturing, chemical manufacturing accounted for a third of the total, or $835.9 billion. There was also sizable investment in finance and insurance ($629.7 billion) and wholesale trade ($534.0 billion).
Foreign MNEs earned income of $310.1 billion in 2025 on their cumulative investment in the United States, a 1.9 percent decrease from 2024.
| Updates to Previously Published Statistics1 [Billions of dollars] | ||||
|---|---|---|---|---|
| U.S. direct investment abroad | Foreign direct investment in the United States | |||
| Previously published | Revised | Previously published | Revised | |
| 2022 | .... | .... | 5,124 | 5,110 |
| 2023 | 6,620 | 6,598 | 5,376 | 5,338 |
| 2024 | 6,827 | 6,698 | 5,708 | 5,598 |
| …. U.S. direct investment abroad data not revised for 2022. 1. U.S. Bureau of Economic Analysis statistics for U.S. direct investment abroad for 2023–2024 and foreign direct investment in the United States for 2022–2024 are revised with this release to incorporate newly available and revised source data. U.S. Bureau of Economic Analysis | ||||
Related Data Tables
For the 2025 direct investment by country and industry tables highlighted in this release, as well as estimates for earlier years, see the below data tables in BEA’s Interactive Data Application and comprehensive data tables for U.S. direct investment abroad and foreign direct investment in the United States.
U.S. direct investment abroad
Country by industry detail (cross-classified by selected country and selected industry)
Position on a Historical-Cost Basis, Country by Industry of Foreign Affiliate
Financial Transactions Without Current-Cost Adjustment, Country by Industry of Foreign Affiliate
Income Without Current-Cost Adjustment, Country by Industry of Foreign Affiliate
Country detail
Position on a Historical-Cost Basis by Detailed Country
Financial Transactions Without Current-Cost Adjustment by Detailed Country
Income Without Current-Cost Adjustment by Detailed Country
Industry detail (includes all industries)
Position on a Historical-Cost Basis by Detailed Industry
Financial Transactions Without Current-Cost Adjustment by Detailed Industry
Income Without Current-Cost Adjustment by Detailed Industry
Additional detail
Position on a Historical-Cost Basis by Account for Selected Countries
Change in the Historical-Cost Position by Account
Position on a Historical-Cost Basis, Industry of Affiliate and by Industry of U.S. Parent
Foreign direct investment in the United States
Country by industry detail (cross-classified by selected country and selected industry)
Position on a Historical-Cost Basis, Country by Industry of U.S. Affiliate
Financial Transactions Without Current-Cost Adjustment, Country by Industry of U.S. Affiliate
Income Without Current-Cost Adjustment, Country by Industry of U.S. Affiliate
Country detail (includes all countries from which there is direct investment)
Position on a Historical-Cost Basis by Detailed Country
Financial Transactions Without Current-Cost Adjustment by Detailed Country
Income Without Current-Cost Adjustment by Detailed Country
Industry detail (includes all industries)
Position on a Historical-Cost Basis by Detailed Industry
Financial Transactions Without Current-Cost Adjustment by Detailed Industry
Income Without Current-Cost Adjustment by Detailed Industry
Additional detail
Position on a Historical-Cost Basis by Account for Selected Countries
Change in the Historical-Cost Position by Account
Ultimate Beneficial Owner (UBO)
Position on a Historical-Cost Basis and Direct Investment Income Without Current-Cost Adjustment by Country of UBO and by Country of Foreign Parent
Position on a Historical-Cost Basis, by Country of UBO
Position on a Historical-Cost Basis, Country of UBO by Industry
Income Without Current-Cost Adjustment, Country of UBO by Industry
Position on a Historical-Cost Basis by Industry of the UBO
Note. BEA has updated its disclosure avoidance method to coarsening, which includes rounding, aggregation, and the use of ranges. This allows BEA to publish more data, while still providing confidentiality to BEA’s survey respondents.
Next release: July 2027
Direct Investment by Country and Industry, 2026