
News Release
GDP (Advance Estimate), 2nd Quarter 2026
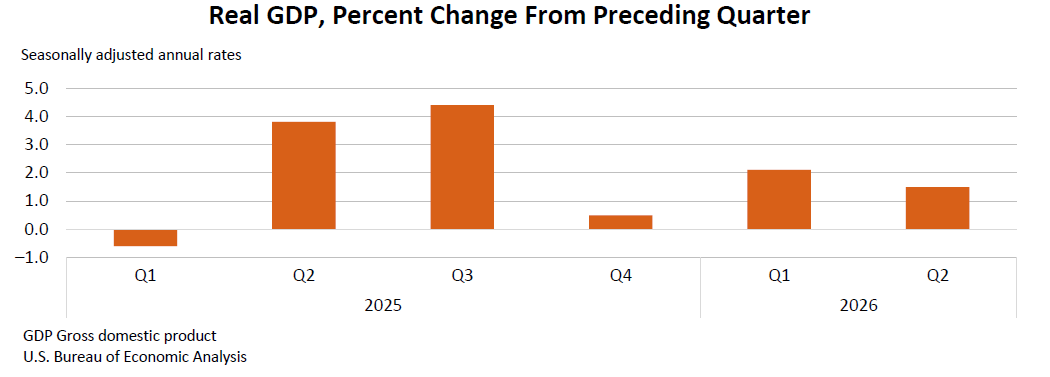
Real gross domestic product (GDP) increased at an annual rate of 1.5 percent in the second quarter of 2026 (April, May, and June), according to the advance estimate released today by the U.S. Bureau of Economic Analysis (BEA). In the first quarter, real GDP increased 2.1 percent.
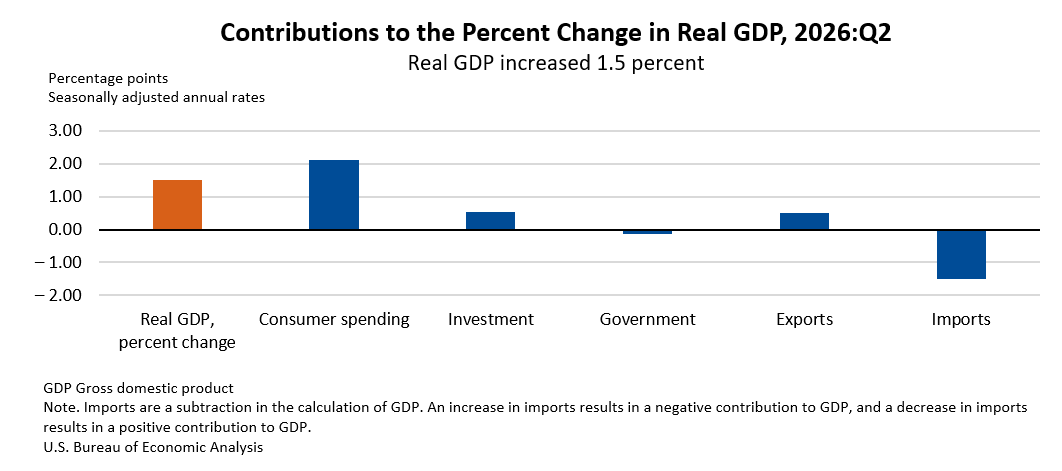
The contributors to the increase in real GDP in the second quarter were increases in consumer spending, investment, and exports that were partly offset by a decrease in government spending. Imports, which are a subtraction in the calculation of GDP, increased. For more information, refer to the "Technical Notes" below.
Compared to the first quarter, the deceleration in real GDP in the second quarter reflected a downturn in government spending and decelerations in investment and exports that were partly offset by an acceleration in consumer spending. Imports increased more in the second quarter than in the first quarter.
Real final sales to private domestic purchasers, the sum of consumer spending and gross private fixed investment, increased 3.9 percent in the second quarter, compared with an increase of 1.7 percent in the first quarter.
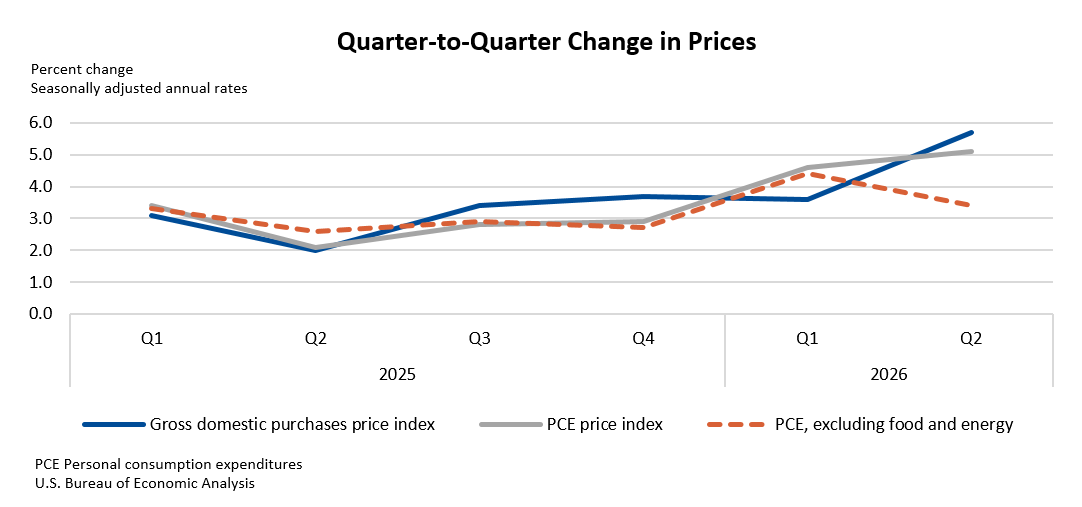
The price index for gross domestic purchases increased 5.7 percent in the second quarter, compared with an increase of 3.6 percent in the first quarter. The personal consumption expenditures (PCE) price index increased 5.1 percent, compared with an increase of 4.6 percent, and the PCE price index excluding food and energy increased 3.4 percent, compared with an increase of 4.4 percent.
| Real GDP and Related Measures [Percent change (SAAR) from 2026:Q1 to 2026:Q2] | |
|---|---|
| Advance Estimate | |
| Real GDP | 1.5 |
| Current-dollar GDP | 7.9 |
| Real final sales to private domestic purchasers | 3.9 |
| Gross domestic purchases price index | 5.7 |
| PCE price index | 5.1 |
| PCE price index, excluding food and energy | 3.4 |
With improvements in the concurrent production of BEA statistics, the 2026 annual updates of national, industry, and regional data will begin on the same day for the first time: September 30, 2026. The annual update of the National Economic Accounts includes GDP, gross domestic income, GDP by industry, monthly personal income and outlays, and related statistics in the National Income and Product Accounts and the Industry Economic Accounts. The update of the Regional Economic Accounts includes GDP by state and by county, personal income by state and by county, and related statistics. For details, refer to "Information on 2026 Annual Updates to the National, Industry, State, and County Statistics."
Next release: August 26, 2026, at 8:30 a.m. EDT
GDP (Second Estimate) and Corporate Profits, 2nd Quarter 2026
Technical Notes
Sources of change for real GDP
Real GDP increased at an annual rate of 1.5 percent (0.4 percent at a quarterly rate1) in the second quarter, reflecting increases in consumer spending, investment, and exports that were partly offset by a decrease in government spending. Imports increased.
More information on the source data and BEA assumptions that underlie the second-quarter estimate is shown in the key source data and assumptions table.
- The increase in consumer spending reflected increases in both goods and services.
- Within goods, the increase was led by other nondurable goods (mainly, prescription drugs), based on Census Bureau Monthly Retail Trade Survey (MRTS) data for all three months of the quarter; motor vehicles and parts (led by new light trucks), based primarily on Wards Intelligence unit sales data and IHS-Polk registrations data; and furnishings and durable household equipment (led by furniture), based on Census Bureau MRTS data.
- Within services, the leading contributors to household consumption expenditures were food services and accommodations, based on Census Bureau MRTS data, and financial services and insurance (led by portfolio management), based primarily on trade volume data. There was also an increase in final consumption expenditures of nonprofits, led by gross output for professional advocacy.
- The increase in investment primarily reflected increases in equipment and intellectual property products that were partly offset by decreases in private inventory investment and nonresidential structures.
- Within equipment, increases were widespread, led by industrial equipment, transportation equipment, and information processing equipment, based primarily on data for imports from the Census Bureau-BEA U.S. International Trade in Goods and Services report and the Census Bureau Advance Economic Indicators Report for June.
- The increase in intellectual property products reflected increases in software (mainly, prepackaged software) and research and development, based primarily on a judgmental trend and Bureau of Labor Statistics Current Employment Statistics.
- The largest contributor to the decrease in private inventory investment was wholesale trade, based primarily on Census Bureau inventory book value data.
- The decrease in nonresidential structures was led by manufacturing structures, based on Census Bureau Value-Put-In-Place construction spending data for April and May and a BEA projection for June.
- Exports and imports primarily reflected Census Bureau-BEA U.S. International Trade in Goods and Services data as well as the Census Bureau Advance Economic Indicators Report for June.
- Within exports, the increase reflected an increase in goods (led by petroleum and related products) that was partly offset by a decrease in services (led by travel and other business services, mainly financial services).
- Within imports, the increase primarily reflected an increase in goods, led by capital goods, except automotive (mainly telecommunications equipment, semiconductors and related devices, and industrial equipment).
- Within government spending, the decrease was led by federal government spending, primarily reflecting nondefense consumption expenditures. The pattern of nondefense spending primarily reflected sales of crude oil from the Strategic Petroleum Reserve, based on data from the Department of Energy. Within the National Economic Accounts, sales are deducted from government consumption expenditures; therefore, an increase in sales results in a corresponding decrease in consumption expenditures. Because the oil sold by the government is reflected as an increase in other components of GDP, there is no direct effect on GDP.
Related Data Tables
For the estimates highlighted in this release, as well as historical time series for these estimates, see the following data tables in BEA’s Interactive Data Application.
Table 1.1.1. Percent Change From Preceding Period in Real Gross Domestic Product
Table 1.5.2. Contributions to Percent Change in Real Gross Domestic Product, Expanded Detail
Table 1.4.1. Percent Change From Preceding Period in Real Gross Domestic Product, Real Gross Domestic Purchases, and Real Final Sales to Domestic Purchasers
Table 1.6.7. Percent Change From Preceding Period in Prices for Gross Domestic Purchases
Note. With the next release of GDP, today’s data will be superseded, and the links above will reflect the latest data. The original data featured in this release can then be accessed in BEA’s Data Archive.
1 Percent changes in quarterly seasonally adjusted series are displayed at annual rates, unless otherwise specified. For more information, refer to the FAQ “Why does BEA publish percent changes in quarterly series at annual rates?”.