
News Release
GDP (Advance Estimate), 4th Quarter and Year 2025
Real gross domestic product (GDP) increased at an annual rate of 1.4 percent in the fourth quarter of 2025 (October, November, and December), according to the advance estimate released today by the U.S. Bureau of Economic Analysis. In the third quarter, real GDP increased 4.4 percent.
The advance report for the fourth quarter of 2025, originally scheduled for January 29, 2026, was rescheduled due to the October–November 2025 government shutdown.

The contributors to the increase in real GDP in the fourth quarter were increases in consumer spending and investment. These movements were partly offset by decreases in government spending and exports. Imports, which are a subtraction in the calculation of GDP, decreased. For more information, refer to the "Technical Notes" below.
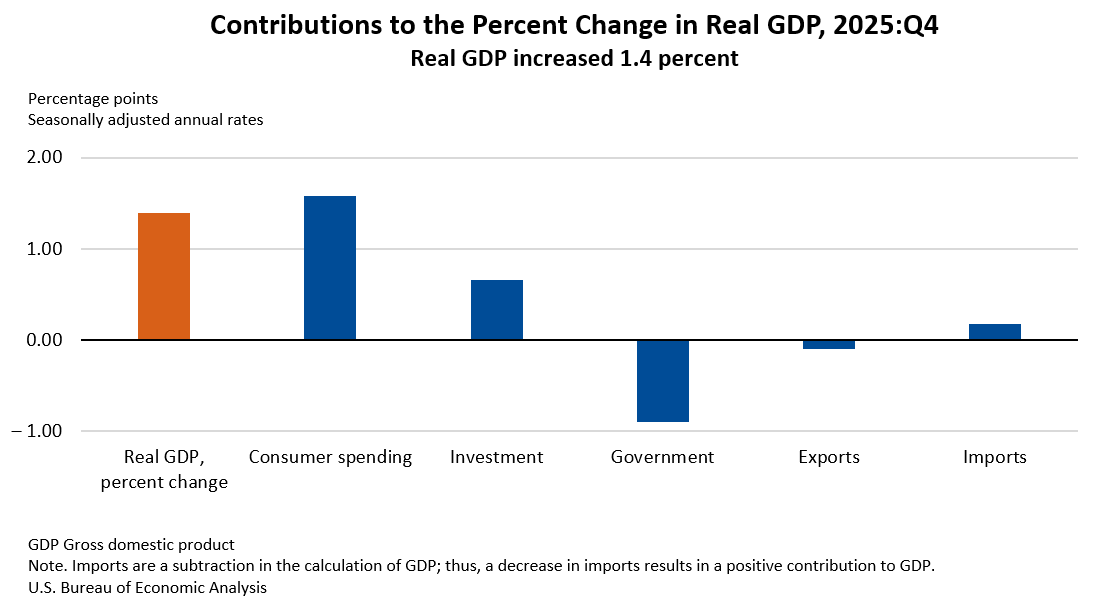
Compared to the third quarter, the deceleration in real GDP in the fourth quarter reflected downturns in government spending and exports and a deceleration in consumer spending that were partly offset by an acceleration in investment. The decrease in imports was smaller than in the prior quarter.
Real final sales to private domestic purchasers, the sum of consumer spending and gross private fixed investment, increased 2.4 percent in the fourth quarter, compared with an increase of 2.9 percent in the third quarter.
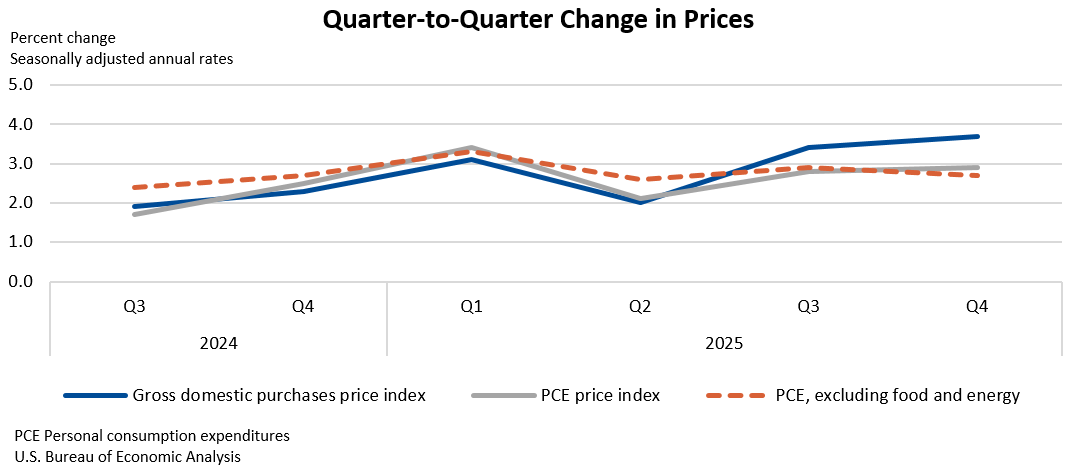
The price index for gross domestic purchases increased 3.7 percent in the fourth quarter, compared with an increase of 3.4 percent in the third quarter. The personal consumption expenditures (PCE) price index increased 2.9 percent, compared with an increase of 2.8 percent. Excluding food and energy prices, the PCE price index increased 2.7 percent, compared with an increase of 2.9 percent. (Refer to “Technical Notes” below for information on how BEA imputed missing Bureau of Labor Statistics (BLS) October prices.)
| Real GDP and Related Measures [Percent change (SAAR) from 2025 Q3 to Q4] | |
|---|---|
| Advance estimate | |
| Real GDP | 1.4 |
| Current-dollar GDP | 5.1 |
| Real final sales to private domestic purchasers | 2.4 |
| Gross domestic purchases price index | 3.7 |
| PCE price index | 2.9 |
| PCE price index excluding food and energy | 2.7 |
GDP for 2025
Real GDP increased 2.2 percent in 2025 (from the 2024 annual level to the 2025 annual level), compared with an increase of 2.8 percent in 2024. The increase in real GDP in 2025 primarily reflected increases in consumer spending and investment.
The price index for gross domestic purchases increased 2.6 percent in 2025, compared with an increase of 2.4 percent in 2024. The PCE price index increased 2.6 percent, the same increase as in 2024. Excluding food and energy prices, the PCE price index increased 2.8 percent, compared with an increase of 2.9 percent.
For definitions, statistical conventions, information on updates to GDP, links to related tables, and more, visit "Additional Information."
BEA’s ongoing modernization and streamlining of news release packages includes improvements beginning with today's GDP news release. The news release text has been modified to include links to BEA’s online Interactive Data Tables. News release tables in PDF and Excel format will no longer be provided beginning with the third estimate for the fourth quarter of 2025 on April 9, 2026. This change will reduce duplication, increase efficiency, and point users directly to the most complete data.
Next release: March 13, 2026, at 8:30 a.m. EDT
GDP (Second Estimate), 4th Quarter and Year 2025
Technical Notes
Sources of change for real GDP
Real GDP increased at an annual rate of 1.4 percent (0.4 percent at a quarterly rate 1) in the fourth quarter, reflecting increases in consumer spending and investment that were partly offset by decreases in government spending and exports. Imports, which are a subtraction in the calculation of GDP, decreased.
More information on the source data and BEA assumptions that underlie the fourth-quarter estimate is shown in the key source data and assumptions table.
- The increase in consumer spending reflected an increase in services that was partly offset by a decrease in goods. Within services, the leading contributors to the increase were health care and other services.
- Within health care, both outpatient services and hospital and nursing home services increased, based primarily on BLS Current Employment Statistics (CES) employment, earnings, and hours data.
- Within other services, the leading contributor to the increase was international travel, based on data from BEA's International Transactions Accounts (ITAs).
- The increase in investment primarily reflected increases in intellectual property products, private inventory investment, and equipment.
- The increase in intellectual property products primarily reflected an increase in research and development (R&D), based on BLS CES and R&D expense data from company financial reports.
- Within private inventory investment, the increase reflected increases in wholesale trade and manufacturing that were partly offset by a decrease in retail trade, based primarily on Census Bureau inventory book value data.
- Within equipment, the increase reflected an increase in information processing equipment (notably, computers and peripherals), based on manufacturers’ shipments from the Census Bureau and BEA’s ITAs.
- The decrease in government spending reflected a decrease in federal government spending. Both nondefense and defense consumption expenditures for employee compensation declined (see detail on the federal government shutdown below).
- The decrease in exports primarily reflected BEA’s ITAs. Within exports of industrial supplies and materials in the National Economic Accounts (NEAs), BEA identified and removed an increase in exports of silver bars used as a form of investment in the fourth quarter. Similar to nonmonetary gold, silver can be used for two purposes: for industrial use (as an input into the production of goods and services) and for investment (as a store of wealth and a hedge against inflation). BEA's NEAs do not treat transactions in valuables, such as nonmonetary gold and silver, as investments; therefore, purchases of precious metals used as a form of investment are not included in consumer spending, gross private domestic investment, or government spending. For more information, refer to "How are exports and imports of nonmonetary gold treated in BEA's National Economic Accounts?".
October prices
Due to a lapse in federal appropriations, BLS could not collect October 2025 consumer price index (CPI) data. Refer to 2025 federal government shutdown impact on the Consumer Price Index on the BLS website for more details.
To replace the missing CPIs, BEA derived seasonally adjusted price indexes for October using the geometric mean of the September and November CPIs. BEA derived non-seasonally adjusted price indexes by applying seasonal adjustment factors from October 2024 to the imputed seasonally adjusted values for October 2025.
Note that in Table 9.1U. Reconciliation of Percent Change in the CPI with Percent Change in the PCE Price Index, the missing CPI values are indicated with dot leaders.
Federal government shutdown
Due to a lapse in appropriations, some federal government agencies were closed, and some employees were furloughed from October 1 through November 12. The full effects of the partial federal government shutdown on the fourth-quarter estimates cannot be quantified because they are embedded in the regular source data that underlie the estimates and cannot be separately identified. However, BEA did estimate the effects of a reduction in the labor services supplied by federal employees. BEA estimates that this reduction in services provided by the federal government subtracted about 1.0 percentage point from real GDP growth in the fourth quarter. Because furloughed federal employees received back pay, the shutdown had no impact on current-dollar federal compensation and was reflected as a temporary increase in the prices paid for federal employee compensation. For more information, an FAQ is available on BEA’s website.
Release Dates in 2026
| Estimate | 2025 Q4 and Year 2025 | 2026 Q1 | 2026 Q2 | 2026 Q3 |
|---|---|---|---|---|
| Gross Domestic Product | ||||
| Advance Estimate | February 20, 2026 | April 30, 2026 | July 30, 2026 | October 29, 2026 |
| Second Estimate | March 13, 2026 | May 28, 2026 | August 26, 2026 | November 25, 2026 |
| Third Estimate | April 9, 2026 | June 25, 2026 | September 30, 2026 | December 23, 2026 |
| Gross Domestic Product by Industry and by State | April 9, 2026 | June 25, 2026 | September 30, 2026 | December 23, 2026 |
| Corporate Profits | ||||
| Preliminary Estimate | --- | May 28, 2026 | August 26, 2026 | November 25, 2026 |
| Revised Estimate | April 9, 2026 | June 25, 2026 | September 30, 2026 | December 23, 2026 |
| All releases at 8:30 a.m. | ||||
Related Data Tables
For the estimates highlighted in this release, as well as historical time series for these estimates, see the following data tables in BEA’s Interactive Data Application.
Table 1.1.1. Percent Change From Preceding Period in Real Gross Domestic Product
Table 1.5.2. Contributions to Percent Change in Real Gross Domestic Product, Expanded Detail
Table 1.4.1. Percent Change From Preceding Period in Real Gross Domestic Product, Real Gross Domestic Purchases, and Real Final Sales to Domestic Purchasers
Table 1.6.7. Percent Change From Preceding Period in Prices for Gross Domestic Purchases
Note. With the next release of GDP, today’s data will be superseded, and the links above will reflect the latest data. The original data featured in this release can then be accessed in BEA’s Data Archive.
1. Percent changes in quarterly seasonally adjusted series are displayed at annual rates, unless otherwise specified. For more information, refer to the FAQ “Why does BEA publish percent changes in quarterly series at annual rates?”.